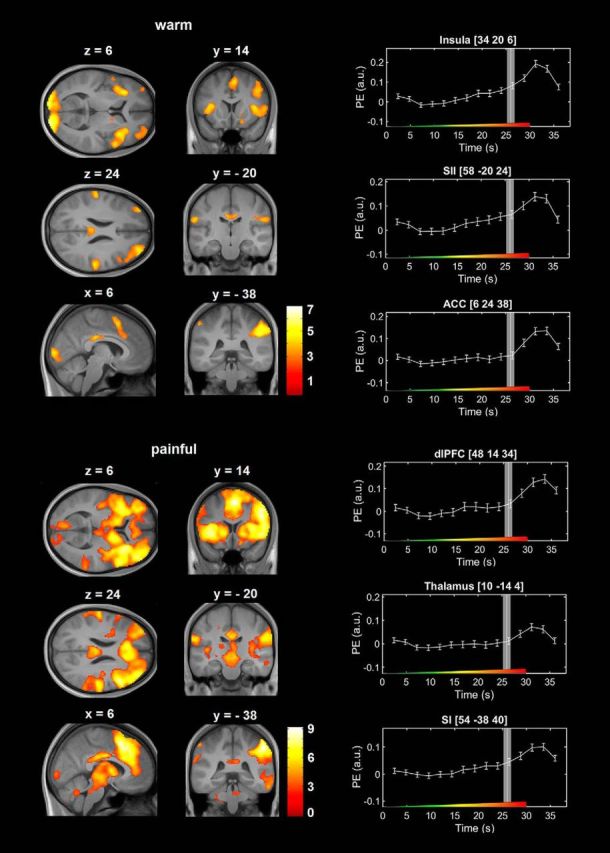
Figure 3.

BOLD responses to the nonpainful and painful phase of ascending thermal stimulation in the brain during the baseline session across all participants. The marked activation of the visual cortex during the nonpainful phase of stimulation is most likely explained by the change of the color of the visually presented crosshair at the beginning of each trial. Right, Peristimulus time courses from selected brain regions. Vertical white lines indicate the HPT in seconds after stimulus onset. Gray bars represent the SEM of the HPT. Color bars represent t values. Error bars indicate SEM. Colored ramp at the bottom of each box represents the ascending thermal stimulus. PE (a.u.), Parameter estimates (arbitrary units).
