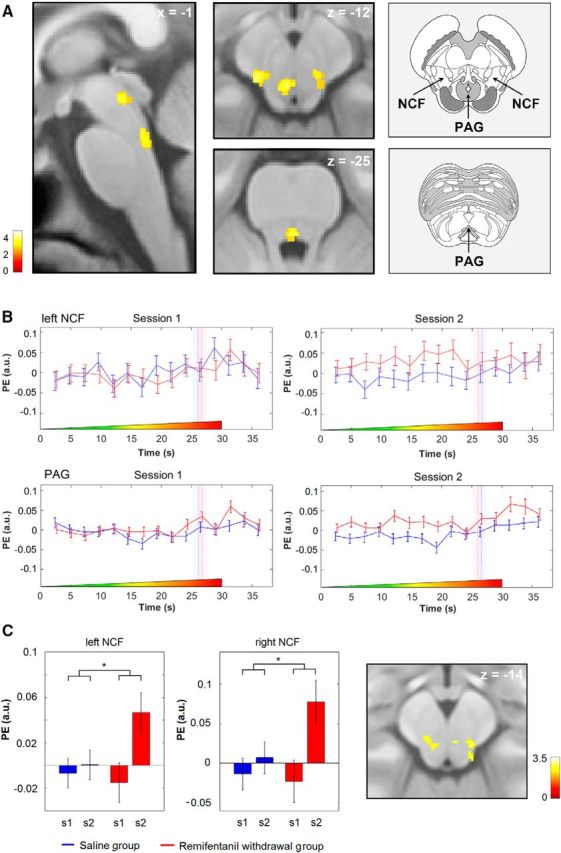
Figure 5.

Increased BOLD responses after discontinuation of remifentanil during the nonpainful period of stimulation compared with control and parametric modulation. A, Activation maps show that BOLD responses in the bilateral NCF and in two portions of the PAG are stronger after discontinuation of remifentanil compared with the saline control group during the nonpainful phase of stimulation. Right, Anatomical images represent the localization of these structures in the brainstem. Modified with permission from Naidich (2009). B, The peristimulus time course in the left NCF and the PAG shows a BOLD signal increase during the nonpainful phase of stimulation after remifentanil suspension compared with control. The time course of the control group was slightly shifted to the left to avoid overlapping of error bars. Dashed vertical lines indicate the HPTs in seconds after stimulus onset. Bars in transparent color represent SEM of the HPT. Colored ramps at the bottom of each box represent the ascending thermal stimulus. C, The peak voxel parameter estimates of an analysis using the trial-by-trial VAS ratings as parametric modulator show a positive correlation between the heat pain ratings and the trialwise responses in the NCF during the nonpainful phase of stimulation exclusively after opioid suspension. Right, Statistical map represents the localization of this finding in the brainstem. The visualization threshold is set to p < 0.005 uncorrected. Error bars indicate SEM. Color bars represent t values. PE (a.u.), Parameter estimates (arbitrary units). *p < 0.05.
