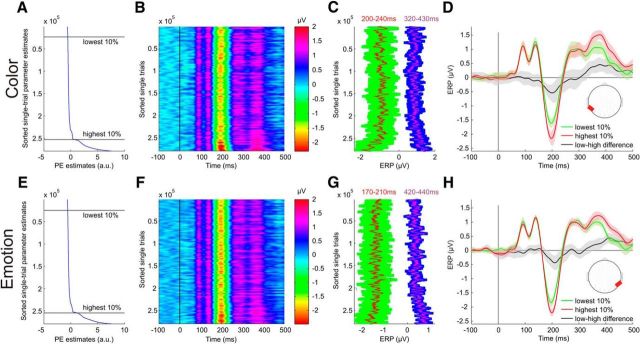
Figure 4.
pwPE parameter estimates and ERP image of all single trials of 34 subjects (>283,000 single trials). Data in all subplots were smoothed with a sliding window of 3000 trials for visualization. A, Mean-centered parameter estimates of pwPEs to color input sorted from minimum (top) to maximum (bottom) values, yielded by the HGF. Data were smoothed using a vertical window of 3000 trials. B, Single-trial ERPs from occipitotemporal electrodes sorted according to their associated pwPE magnitude. Note vertical lines corresponding to ERP peaks and troughs. C, Mean ERP amplitudes over the intervals with significant correlation between pwPE and ERP. Red and purple lines show potential values averaged over the intervals 200–240 and 320–430 ms, respectively. Confidence intervals (SD) resulted from the time windows used per time point. D, ERP waveforms calculated across 10% of trials with the lowest and highest pwPE parameter estimates. Confidence intervals (SD) resulted from the single trials. Note the difference between waveforms in the intervals where significant pwPE-related activity has been found with multiple regression. Red areas in head plots show scalp regions where electrodes were used for plotting the ERP waveforms. E–H, Data for emotion pwPEs plotted similarly as for color above.

