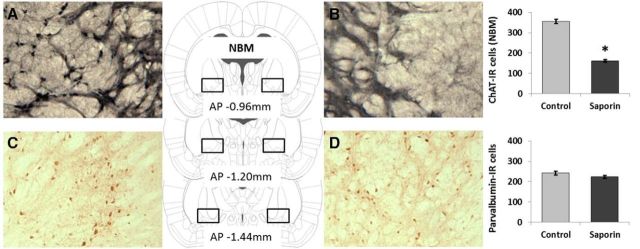
Figure 2.
ChAT and parvalbumin immunohistochemistry of the nucleus basalis magnocellularis. The figure shows the photomicrographs of the ChAT- and parvalbumin-immunoreactive cells in the NBM of a ACh-NBM-lesioned (B, D) and sham-lesioned (A, C) rats. There was a marked decrease in the number of ChAT-IR cells in the NBM of the ACh-NBM-lesioned rats (B) compared with sham-lesioned rats (A). The number of parvalbumin-IR cells in the NBM was comparable between the groups (C, D). The rectangular outlines superimposed on the rat brain coronal schematics approximately correspond to the NBM cell-counting frames. Rat brain schematics were adapted from Paxinos and Watson (2007) and displayed coordinates refer to the AP plane. (nsham-lesioned = 9; nACh-NBM-lesioned = 10). *Indicates significant difference at p < 0.05. Bars show mean cell count ± SEM.

