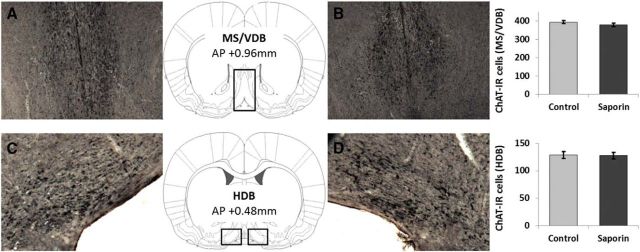
Figure 3.
ChAT immunohistochemistry of the MS/VDB and the HDB. The figure depicts the rat MS/VDB (A, B) and HDB (C, D) following the ChAT immunostaining. There was no group difference in the number of ChAT-IR cells in either of these areas. (nsham-lesioned = 9; nACh-NBM-lesioned = 10). Bars show mean cell count ± SEM.

