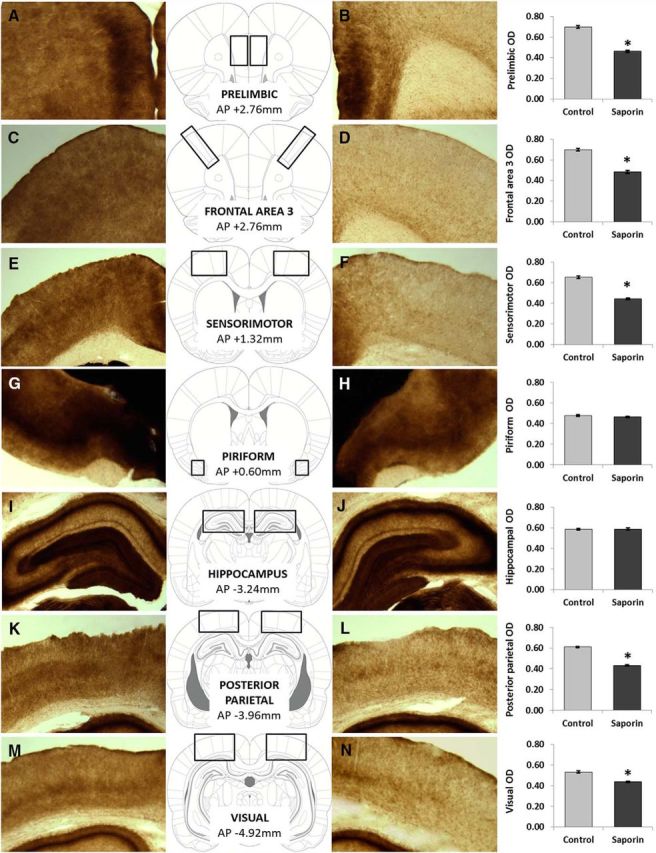
Figure 4.

AChE histochemistry. The figure depicts various cortical areas following the AChE staining: prefrontal area 1 (A, B), prefrontal area 2 (C, D), prefrontal area 3 (E, F), olfactory cortex (G, H), hippocampus (I, J), posterior parietal cortex (K, L), and from the primary and secondary visual cortices (M, N; as delineated by Paxinos and Watson, 2007). We have observed significantly lower adjusted OD values in all neocortical areas of ACh-NBM-lesioned rats (B, D, F, L, N). Importantly, the OD values from olfactory cortex and hippocampus were equivalent for two groups. (nsham-lesioned = 9; nACh-NBM-lesioned = 10). *Indicates significant difference at p < 0.05. Bars show mean OD ± SEM.
