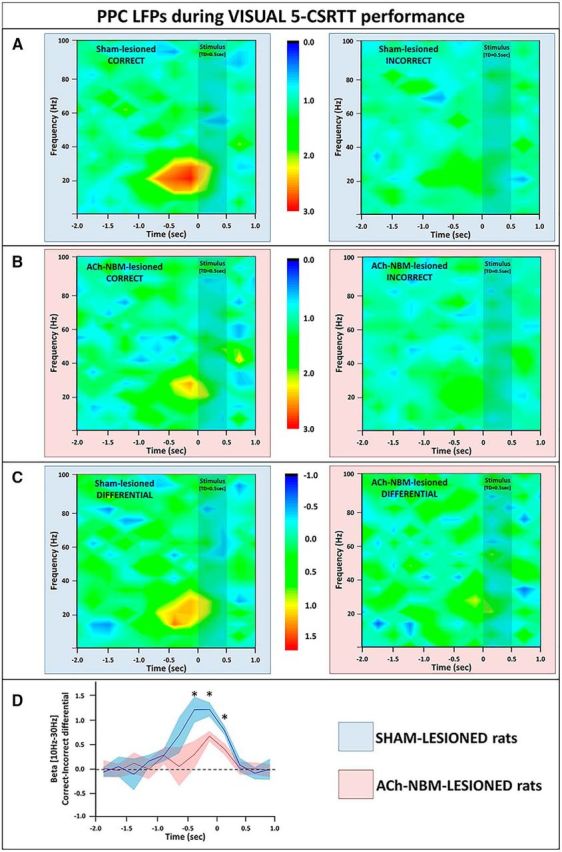
Figure 8.

LFP findings from the PPC during performance on the visual target-detection task. A, We observed an increase in the PPC beta power (10–30 Hz) on correct trials (left), but not on incorrect trials (right) on the visual task. Spectrograms show power normalized against the power from the baseline period. B, The normalized spectral power from the PPC of ACh-NBM-lesioned rats on correct (left) and incorrect trials (right) on the visual 5-CSRTT. Pretarget beta burst of power was attenuated in ACh-NBM-lesioned rats, compared with controls. C, Spectrograms created by calculating the difference between the PPC power on correct trials and the PPC power on incorrect trials; left, sham-lesioned; right, ACh-NBM-lesioned. D, Correct-Incorrect differential beta power was attenuated in ACh-NBM-lesioned rats compared with sham-lesioned rats. Shaded area around the lines shows SEM. Results showing the behavioral measures of the task at this stage of testing are shown in Table 5. *Indicates significant difference at p < 0.05.
