Figure 3.

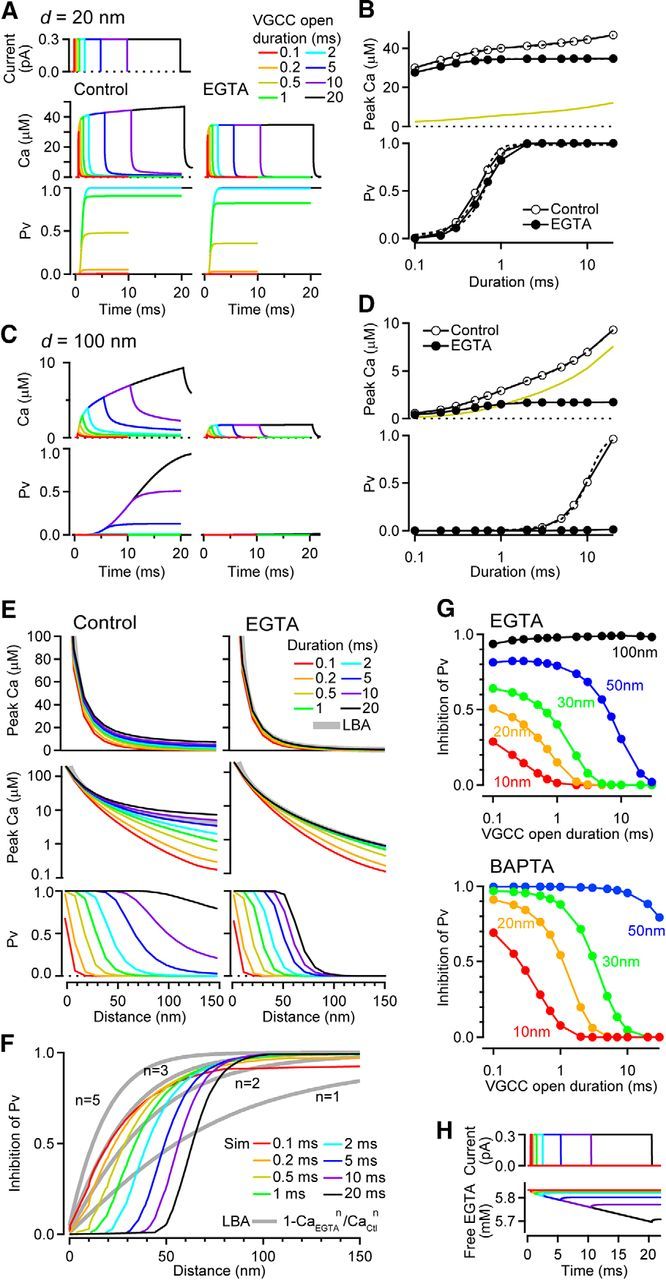
Inhibition of release probability by EGTA depends on the open duration of a VGCC. A, [Ca2+] transient and resulting Pv at 20 nm from the VGCC for control (left) and 10 mm EGTA (right). The VGCC open duration was varied from 0.1 to 20 ms (top; 0.3 pA amplitude). B, Peak [Ca2+] (top) and Pv (bottom) at 20 nm as a function of VGCC open duration. Dashed lines are a double (control) and single (EGTA) exponential fit of [Ca2+], and sigmoidal fits of Pv. Yellow line is the difference in [Ca2+]. C, D, Same as A and B but at 100 nm from the VGCC. E, Peak [Ca2+] (top: linear scale and middle: log scale) and Pv (bottom) for control (left) and EGTA (right) as a function of coupling distance. Gray thick line (top) indicates [Ca2+] profile estimated using a LBA with the same single VGCC current amplitude (0.3 pA). F, Inhibition of Pv by EGTA, calculated from Pv in E and from LBA according to Equation 22 in Neher (1998b). G, Inhibition of Pv by 10 mm EGTA (top) and 1 mm BAPTA (bottom) as a function of VGCC open duration and for different VGCC–sensor distances. H, Free EGTA concentration during various durations of channel opening for a total EGTA concentration of 10 mm.
