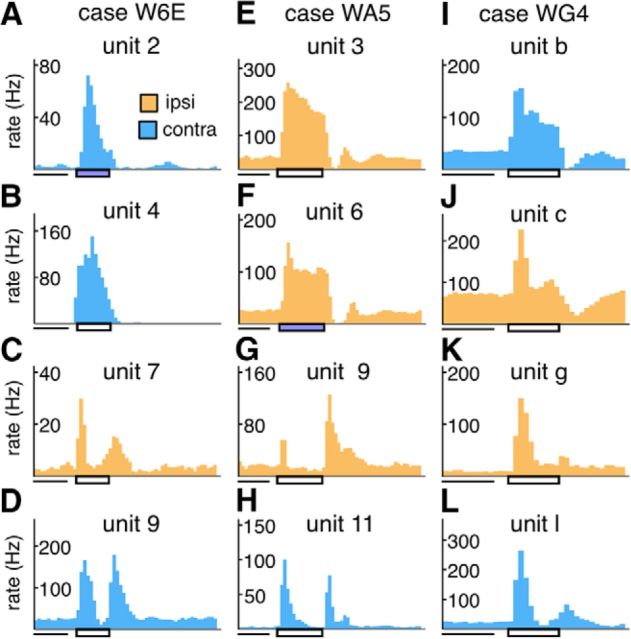
Figure 7.
The PSTHs of representative units recorded in lesion projection zones. The color of the histogram represents the eye dominance of the unit. Light blue represents contralateral eye. Orange represents ipsilateral eye. Horizontal rectangle underneath the x axes represents the time interval during which the stimulus was turned on. White rectangle represents a white stimulus. Blue rectangle represents that a blue stimulus was used. The PSTHs in each column are from units sampled in the same penetration, for 1 case in each of the three groups (A–D: case W6E; E–H: case WA5; I–L: case WG4). The receptive field associated with each unit can be identified in Figures 4–6 by the unit label above each PSTH.

