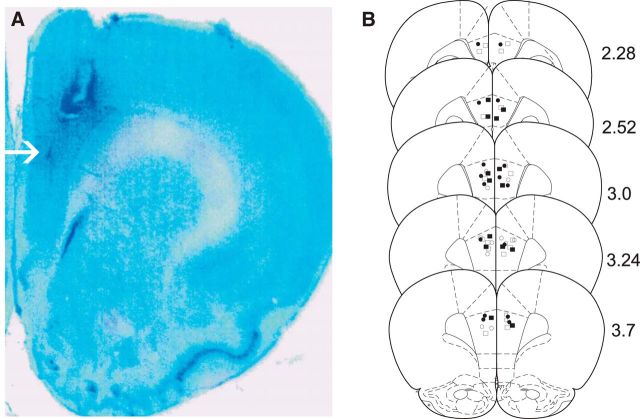
Figure 2.
Histological analysis of PFC injector placements. A, Representative microphotograph showing a typical intra-PFC injector placement. B, Schematic representation of bilateral intra-PFC injector placements. Figure symbols represent the following experimental groups: ● = PFC VEH controls receiving CS+ presentations during the fear recall test; □ = rats receiving SKF81297 100 ng/0.5 μl; ■ = rats receiving intra-PFC PD168077 50 ng/0.5 μl.

