
Figure 4.
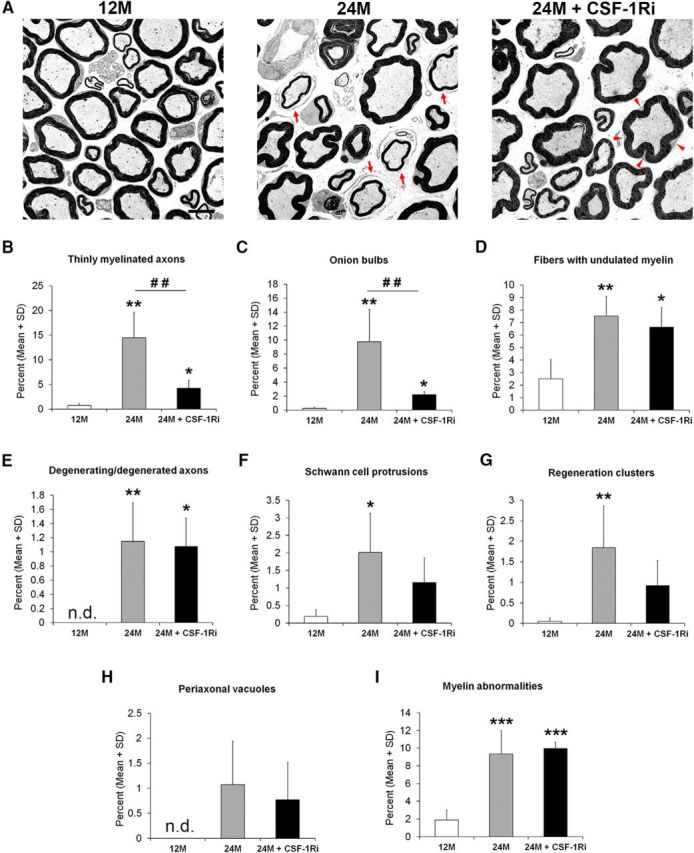
Pathological alterations characteristic for demyelination in peripheral nerves of aged mice were ameliorated after CSF-1Ri treatment. A, Electron microscopy of representative ultrathin sections of femoral quadriceps nerves from 12M, 24M, or 24M + CSF-1Ri mice. Features indicative of demyelination, as exemplified by thin myelin and onion bulbs (A, arrows, 24M), are lacking after CSF-1Ri treatment (24M + CSF-1Ri), whereas the undulating appearance of the myelin sheaths (arrowheads) is not changed in the 24-month-old treated mice. This feature is lacking in 12-month-old mice. Scale bar, 5 μm. B–I, Quantification of (B) thinly myelinated axons and (C) onion bulbs reflect a substantial alleviation of demyelination after treatment, whereas (D) fibers with undulated myelin, (E) degenerating or degenerated axons, (F) Schwann cell protrusions, (G) regeneration clusters, (H) periaxonal vacuoles, and (I) myelin abnormalities comprising myelin inclusion, myelin outfoldings, and tomacular structures are not influenced by the treatment. n.d., Not detected. Note different ranges of size (y-axis) of the different pathological features. Values are expressed as mean ± SD, n = 4–7. *p < 0.05, significance compared with 12M. **p < 0.01, significance compared with 12M. ***p < 0.001, significance compared with 12M. ##p < 0.01, significance between 24M and 24M + CSF-1Ri mice. B, Kruskal–Wallis test: 12M versus 24M, p = 0.008; 24M versus 24M + CSF-1Ri, p = 0.004; 12M versus 24M + CSF-1Ri, p = 0.014. C, Kruskal–Wallis test: 12M versus 24M, p = 0.008; 24M versus 24M + CSF-1Ri, p = 0.004; 12M versus 24M + CSF-1Ri, p = 0.014. D, One-way ANOVA: 12M versus 24M, p = 0.008; 24M versus 24M + CSF-1Ri, p = 0.777; 12M versus 24M + CSF-1Ri, p = 0.037. E, One-way ANOVA: 12M versus 24M, p = 0.008; 24M versus 24M + CSF-1Ri, p = 0.959; 12M versus 24M + CSF-1Ri, p = 0.018. F, One-way ANOVA: 12M versus 24M, p = 0.029; 24M versus 24M + CSF-1Ri, p = 0.265; 12M versus 24M + CSF-1Ri, p = 0.329. G, Kruskal–Wallis test: 12M versus 24M, p = 0.008; 24M versus 24M + CSF-1Ri, p = 0.062; 12M versus 24M + CSF-1Ri, p = 0.055. H, One-way ANOVA: 12M versus 24M, p = 0.079; 24M versus 24M + CSF-1Ri, p = 0.759; 12M versus 24M + CSF-1Ri, p = 0.280. I, One-way ANOVA: 12M versus 24M, p < 0.001; 24M versus 24M + CSF-1Ri, p = 0.850; 12M versus 24M + CSF-1Ri, p < 0.001.