
Figure 5.
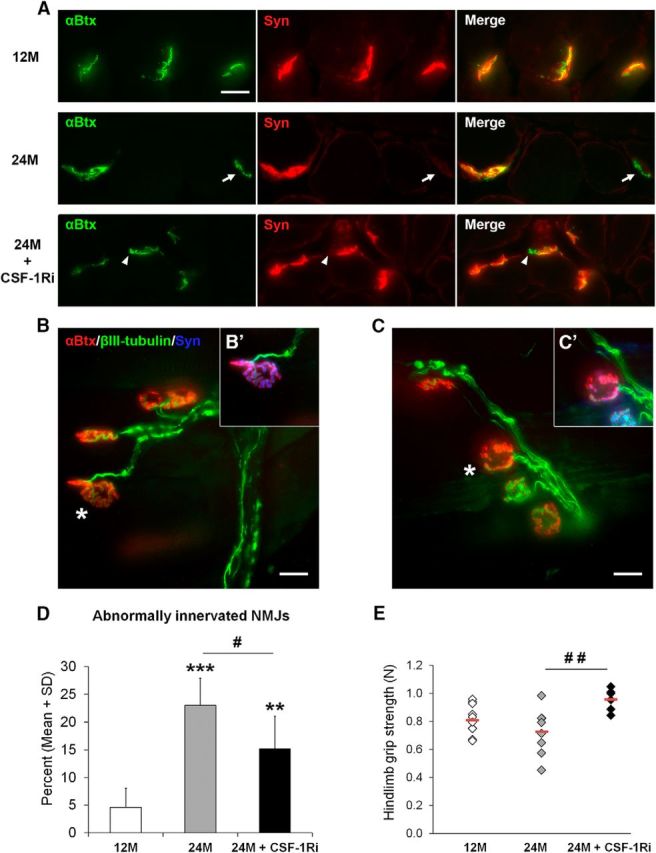
Ameliorated innervation of NMJs (A–D) and improved muscle function (E) in aged mice after CSF-1Ri treatment. A, Examples of completely innervated NMJs (top row, 12M), completely denervated NMJs (arrows, middle row, 24M), and partially denervated NMJs (arrowheads, bottom row, 24M + CSF-1Ri) as identified by double-immunolabeling with synaptophysin (red) and α-bungarotoxin (green) in cross sections of flexor digitorum brevis muscle of 12M, 24M, and 24M + CSF-1Ri mice. Right column represents merged double immunofluorescence. Scale bar, 20 μm. B, C, Examples of whole-mount preparations of flexor digitorum brevis muscles of 12M (B) and 24M (C) mice showing completely innervated and partially denervated NMJs, respectively, as identified by merged α-bungarotoxin (red) and βIII-tubulin (green) labeling. B′, C′, The same junctions as indicated in B, C (asterisks), with synaptophysin (blue) as an additional presynaptic marker. There is complete innervation in B, B′ and partial denervation in C, C′. D, Quantification of abnormally innervated NMJs from cross sections of flexor digitorum brevis muscle from 12M, 24M, or 24M + CSF-1Ri mice. Values are mean ± SD; n = 6 or 7. **p < 0.01, significance compared with 12M. ***p < 0.001, significance compared with 12M. #p < 0.05, significance between 24M and 24M + CSF-1Ri mice. ##p < 0.01, significance between 24M and 24M + CSF-1Ri mice. One-way ANOVA: 12M versus 24M, p < 0.001; 24M versus 24M + CSF-1Ri, p = 0.023; 12M versus 24M + CSF-1Ri, p = 0.003. E, Grip strength of 12M, 24M, or 24M + CSF-1Ri mice. Diamond represents one individual mouse. Red lines indicate the mean values of the corresponding group; n = 6–8. #p < 0.05, significance between 24M and 24M + CSF-1Ri mice. ##p < 0.01, significance between 24M and 24M + CSF-1Ri mice. One-way ANOVA: 12M versus 24M, p = 0.320; 24M versus 24M + CSF-1Ri, p = 0.006; 12M versus 24M + CSF-1Ri, p = 0.068.