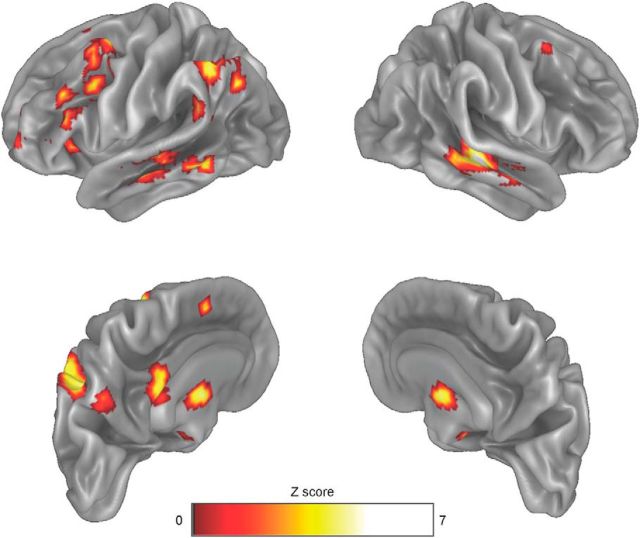
Figure 3.
Whole-brain analysis map. Map represents regions of significant neuronal activation during the drug imagery period, regardless of drug and setting, relative to the baseline imagery period. Whole-brain analysis conducted in SPM8 using an “omnibus” F contrast revealed significant changes in the regions showed below (PFWE < 0.05 at the voxel level). Voxels below threshold are not rendered in color.

