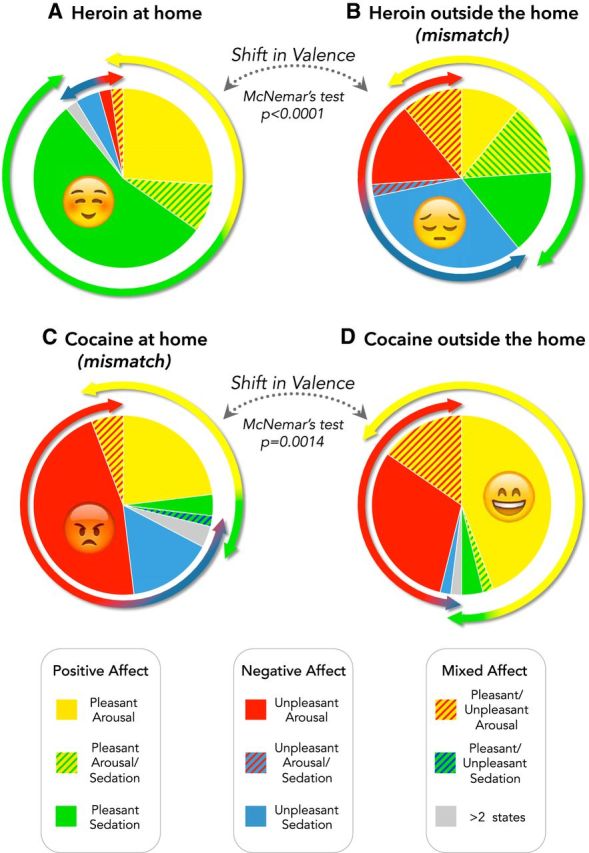
Figure 4.

Subjective appraisal of the emotional valence of drug experience as a function of drug and setting. Pie charts represent the proportion of participants reporting the affective states detailed in the legend and illustrated in Figure 1B after heroin (A, B) or cocaine (C, D) use. The McNemar's test indicated significant shifts in valence as a function of the setting of drug use. A small proportion of participants reported two affective states (hatched lines) or more (gray).
