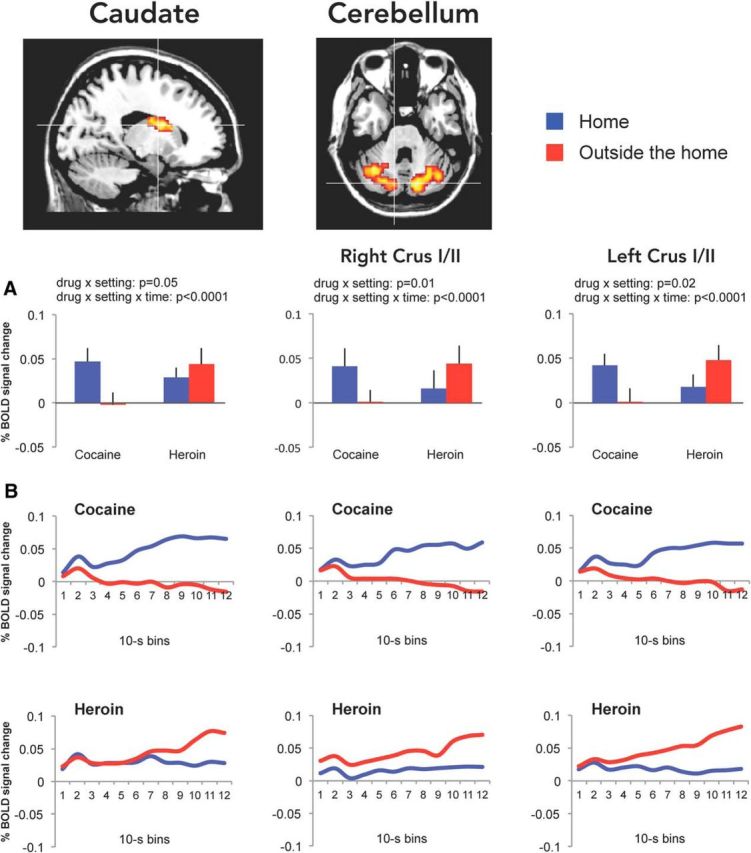
Figure 6.

BOLD signal changes in the left caudate and in the cerebellum. Mean (±SEM) BOLD signal changes (A) during the drug imagery task (relative to baseline imagery) in the caudate and cerebellum obtained by averaging the values of 12 10 s bins calculated using finite impulse response analysis (B).
