Figure 5.

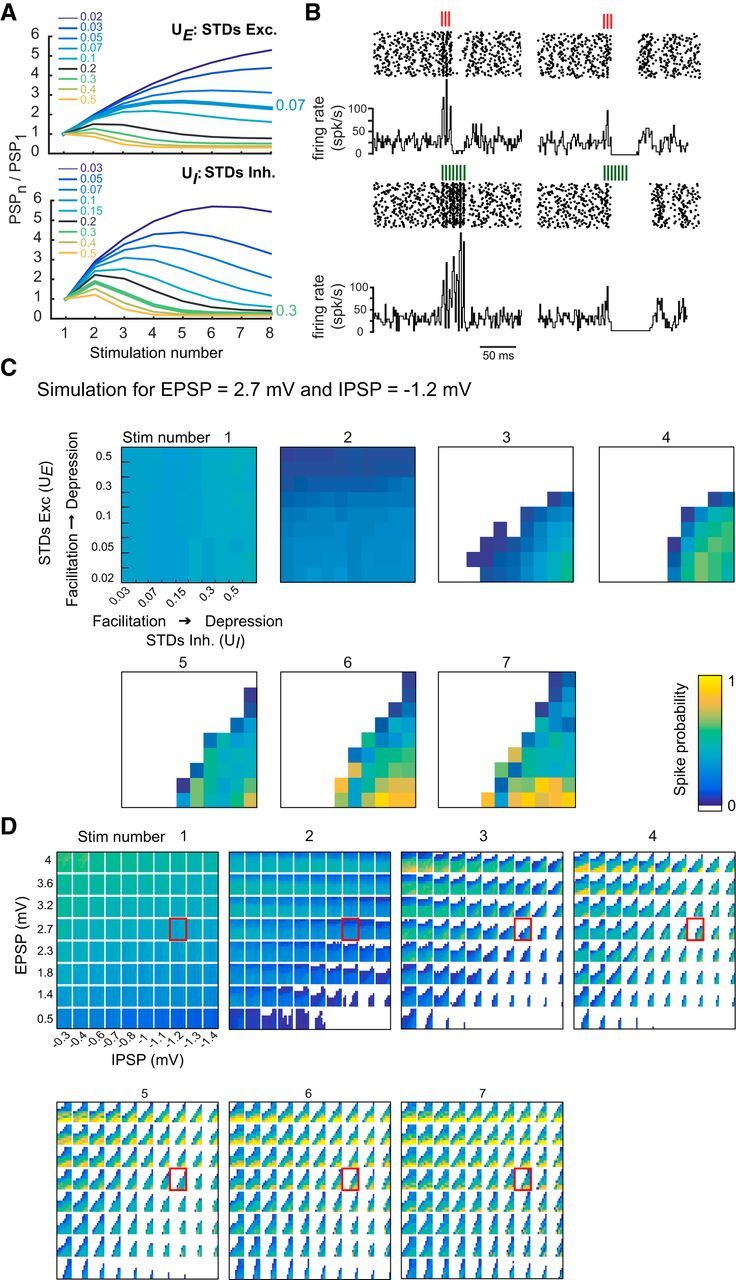
Varying E, I, and STD at the excitatory and inhibitory pathways of a simple model reproduces discharge patterns seen in vitro. A, STD of simulated EPSPs (top) and IPSPs (bottom). Ratios PSPn/PSP1 were determined for a range of U variables (UE and UI for excitation and inhibition, respectively; see Materials and Methods). Thicker lines indicate UE and UI values simulating the averaged experimental STD (Fig. 4). B, Examples of simulated raster plots and PSTH. Left, Response of a PC for 3 and 7 GrC stimuli at 200 Hz. Excitation is strong and facilitates, whereas inhibition is small and depresses mildly (EPSPs = 3.0 mV at −70 mV, UE = 0.05; IPSP = −0.8 mV at −70 mV, UI = 0.3). Right, Simulated PC response for weak depressing excitation and strong facilitating inhibition (EPSPs = 1.2 mV, UE = 0.5; IPSP = −1.2 mV at −70 mV, UI = 0.05). C, Reproducing PC response variability by combining E/I balance and STD. Spike probability for a given set of E/I balance (EPSP = 2.7 mV and IPSP = −1.2 mV). Inner rectangles in each subpanel represent the spike probability following a given stimulation (5 ms window) as a function of STD. Within each subpanel, EPSPs range from facilitating to depressing from bottom to top, whereas IPSPs go from facilitating to depressing from left to right. D, Spike probability following GrC stimulation (1–7) as a function of EPSP (y axis) and IPSP (x axis) amplitudes. Inner rectangles in each subpanel represent the spike probability as a function of STD as in C. Rectangles highlighted in red represent EPSP = 2.7 mV and IPSP = −1.2 mV expanded in C.
