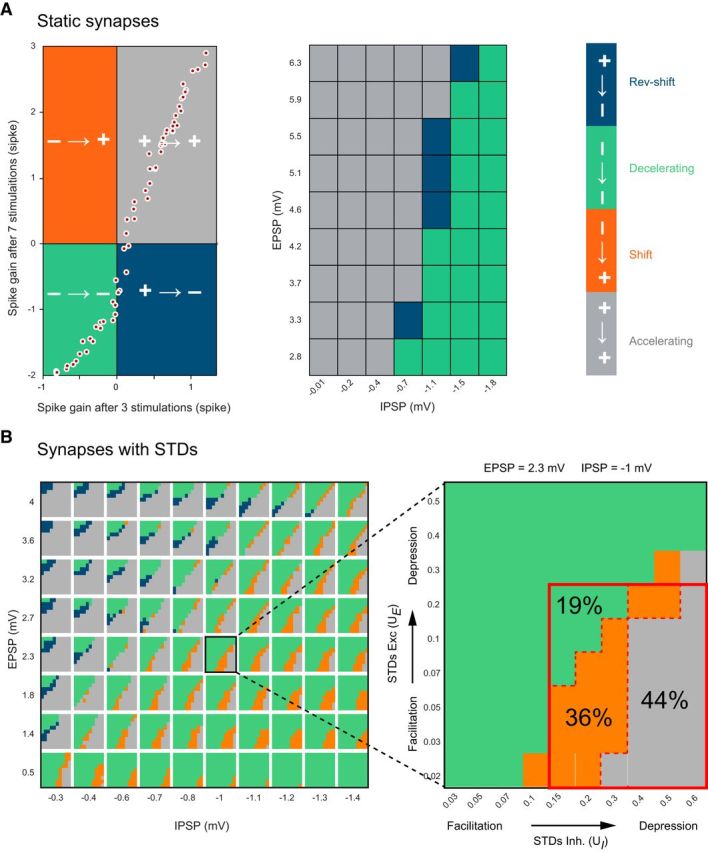
Figure 6.

The shift group of PC responses requires STD at excitatory and inhibitory pathways. A, Left, Plot of the spike gain elicited by 7 GrC stimuli against spike gain for 3 stimuli when GrC-PC and MLI-PC synapses are static (no STD). The four possible scenarios for the spike gain are marked in different colors. Gray and green represents no change in the sign of the spike gain between 3 and 7 GrC stimuli; gray and green correspond to accelerating and decelerating PC response groups, respectively. Blue and orange represents change in the sign of the spike gain; blue and orange correspond to reverse-shift and shift PC response groups, respectively. Each white dot indicates spike gains for different combinations of E and I. The absence of any points in the orange quadrant shows that, without STD, it is not possible to observe negative spike gains for 3 GrC stimuli then positive for 7 stimuli (i.e., the shift group of PC responses is absent). Middle, PC response group as a function of E and I for static synapses. For no combination of EPSP and IPSP amplitude did we obtain a shift in the spike gain as observed in in vitro experiments. B, Evolution of the sign of the spike gain with dynamic synapses (with STD) as a function of EPSP (y axis) and IPSP (x axis) amplitudes (left) when GrC stimulations switch from 3 to 7 GrC stimulations. Inset, Inner rectangles represent excitatory STD UE (y axis) as a function of inhibitory STD UI (x axis). Same color code as in A. The reverse group is absent when simulations are restricted to UE and UI values corresponding to the physiological range observed in our recordings (red rectangle, Inset). One rectangle has been highlighted to illustrate the influence of STD of excitation (y axis) and inhibition (x axis) on the behavior of the PC response.
