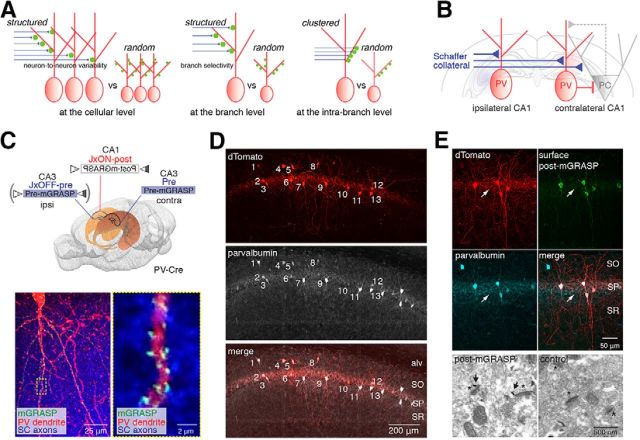
Figure 1.
Structured synaptic connectivity patterns and expression of post-mGRASP in PVs. A, Structured versus random synaptic connectivity patterns at the cellular and (inter-)branch levels. B, Schematic illustration of circuits in hippocampal CA1 excitatory PCs and inhibitory PVs innervated by SCs. C, Strategy to label synapses on CA1 PVs innervated by SC inputs with mGRASP and example fluorescent image showing green reconstituted mGRASP signals at sites where dense CA3 blue axons expressing mCerulean-conjugated pre-mGRASP intersect with CA1 PV red dendrites coexpressing post-mGRASP and dTomato (left). The high-magnification image indicated by the dashed box (left) shows the discrete puncta of reconstituted mGRASP signals (right). D, All post-mGRASP-labeled cells coexpressing dTomato, marked by numbers, are PV+ neurons, as verified by fluorescence immunostaining with an antibody against parvalbumin. Approximately 97% of post-mGRASP-labeled cells were PV+ (n = 65 PVs). E, Top, Postsynaptic distribution of post-mGRASP in PVs was confirmed by fluorescence immunostaining. Surface post-mGRASP (visualized by anti-GFP) was expressed predominantly in postsynaptic compartments, with no detectable expression in axons of PVs in SP (visualized by coexpressed cytosolic dTomato signals; arrow). Most of the post-mGRASP-expressing cells were PV+. Bottom, An EM image shows that post-mGRASP (arrows) was specifically detected in the postsynaptic density of PVs (asterisks) in PV-Cre mice infected with Cre-dependent post-mGRASP AAV; uninfected control PV-Cre mice show no immune signal.

