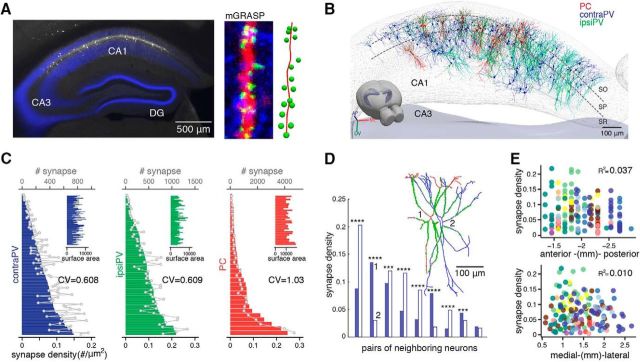
Figure 2.
Moderate cellular-level variability in synaptic connectivity of SCs onto CA1 PVs. A, Left, An example fluorescent image shows CA1 PVs coexpressing post-mGRASP and dTomato (white) along with dense contralateral CA3 projections expressing mCerulean-conjugated pre-mGRASP (blue). Middle, An example PV dendrite showing discrete reconstituted mGRASP signals (green puncta) in sites where dense CA3 axons (blue) intersect with a PV dendrite (red). Right, Reconstruction of this dendrite with annotated synapses. B, All reconstructed neurons (contraPVs, blue; ipsiPVs, cyan; PCs, red) and detected synapses (green dots) registered to the Allen Brain Atlas 3D hippocampus mesh. C, The sorted bar plot shows variations in synapse density per neuron across the population [contraPV: 0.062 ± 0.038 (mean ± SD) synapse/μm2, range 0.0034–0.15; ipsiPV: 0.092 ± 0.056 synapse/μm2, range 0.0075–0.22]. Overlaid gray lines indicate numbers of synapses (contraPV: 357 ± 244 per neuron, range 24∼959; ipsiPV: 451 ± 312, range 29∼1333), and insets show the surface area of each neuron (contraPV: 5768 ± 1895 μm2, range 2526∼10,354; ipsiPV: 4843 ± 1539 μm2, range 1775∼9191). The degree of neuron-to-neuron variability in synaptic density, measured by CV of PVs is significantly lower than that of PCs (MSLRTcontraPV-ipsiPV = 0.0069, pcontraPV-ipsiPV = 0.93, MSLRTcontraPV-PC = 5.97, pcontraPV-PC = 0.015, MSLRTipsiPV-PC = 4.86, pipsiPV-PC = 0.028, MSLRT for equality of CVs). The cellular-level PC data are from a previous study (Druckmann et al., 2014). D, A comparison of synapse density of nearest-neighbor pairs in a single contraPV animal shows variable synaptic density. ***p < 0.001, ****p < 0.0001, exact binomial test. Inset, An example pair of reconstructed PVs marked 1 and 2, along with their synapses (green dots). E, A scatter plot of synapse density versus spatial location of PVs shows no topological pattern along the AP or the ML axis. Dots in different colors indicate individual PVs from different animals (binned from 100-μm-thick sections of contraPVs and ipsiPVs).

