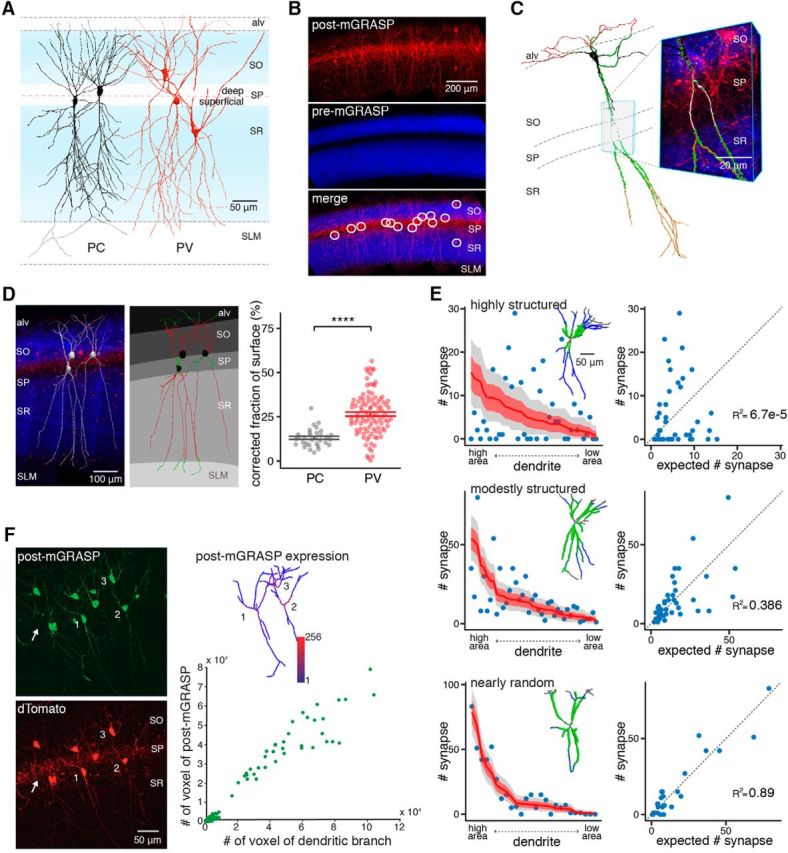
Figure 3.

Laminar correction and the synapse distribution patterns of PVs at the dendritic branch level. A, Representative PCs and PVs with schematic broad CA3 inputs (blue) showing their soma locations and extended dendrites throughout hippocampal CA1 strata. B, The majority of post-mGRASP-expressing PVs (red) innervated by dense pre-mGRASP-expressing CA3 axons of neurons (blue) are detected in SP. C, Example reconstructed PV with detected synapses (green puncta) and zoomed-in view with overlaid fluorescent image (PV dendrites, red; CA3 axons, blue; mGRASP, green), requiring laminar correction because of the contact-free spaces along continuous dendrites. D, Laminar correction was performed on the basis of blue SC axonal signal on red PVs from fluorescent images (left). Layers are segmented, and branch portions in alv, SP, and SLM (shown in green) are determined for targets of laminar correction. The red portions of dendrites were used for further analyses (middle). A summary of the fraction of subtracted surface (FoS) by laminar correction shows significantly higher FoS in PVs than in PCs. Each dot represents an individual neuron, and lines indicate the mean ± SEM of each cell group. ****p < 0.0001, Welch's t test (right). E, Example PVs exhibiting highly structured, moderately structured, and nearly random synaptic distribution of PVs at the branch level. Left, Scatter plots show the number of synapses on each dendritic branch sorted by surface area, whereas overlaid red lines indicate the number of synapses expected from a random null model; light red regions and gray regions indicate ±1 SD and the 95% confidence interval of the expected number of synapses, respectively. Inset, Corresponding reconstructed PVs with detected synapses (green). Right, Scatter plots show the relationship between number of synapses expected in the random null model and actual number of synapses. Branch-level connectivity patterns of individual PVs are shown in Extended Table 3-1. F, The small degree of variation in the expression of post-mGRASP along PVs branch by branch was confirmed by immunostaining with anti-GFP (left) and the relationship between the numbers of branch voxels and the numbers of post-mGRASP voxels (branches from 11 cells of 2 mice, Spearman's ρ = 0.84, p = 3.4 × 10−48; right). Inset, A color map of the intensity of post-mGRASP in the three reconstructed PVs. Additionally, the lack of detectable expression in axons of PVs in SP visualized by coexpressed cytosolic dTomato signals (arrow) supports predominantly postsynaptic expression.
