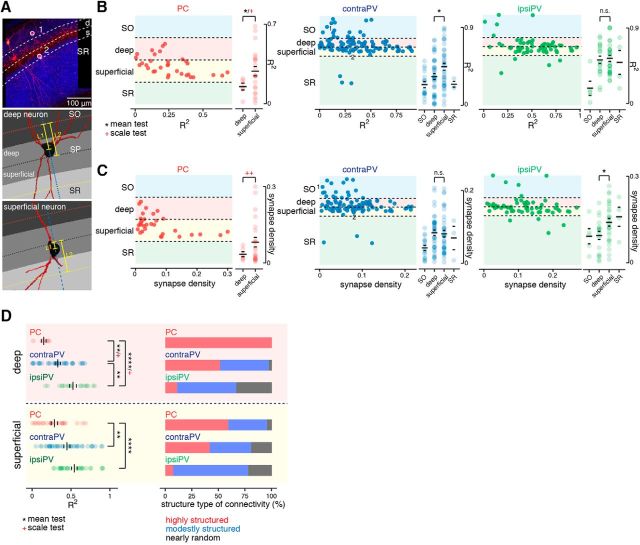
Figure 5.
Sublayer-specific patterns of synaptic connectivity at the branch level. A, Top, An example fluorescent image of mGRASP-expressing PVs (red) and SC axonal inputs (blue) shows two different subgroups of PVs defined by somata in different hippocampal strata, in this case SO and superficial sublayer of SP, marked 1 and 2, respectively. Bottom, Deep and superficial neurons are distinguished by the ratio of L1 to L2, which measures the relative offset of the soma once layers are segmented on the basis of axonal signals (Fig. 3D). The blue dashed line is drawn to pass through the center of the soma, perpendicular to the boundary between the deep and superficial sublayers. L1 is the distance between the nearest dorsal boundary from the soma and the center of the soma along the blue dashed line, and L2 is the distance between the two nearest boundaries along the blue dashed line. B, Scatter plots (left) show the branch-level structure of connectivity (R2 value) of each neuron located in the hippocampal strata. Each dot represents an individual neuron. Soma location was determined by relative offset as described in A and in Materials and Methods. A summary of R2 values of individual neurons subclassified by layer and sublayer populations (right). Significant differences in the means and/or scales of R2 values between deep and superficial subpopulations were observed in PCs and contraPVs but not in ipsiPVs. *p < 0.05, Welch's t test for mean; red +p < 0.05, Conover–Iman scale test for scale; n.s., not significant (right). C, Scatter plots of the synaptic density of each neuron in the hippocampal strata. Significant differences in means or scales of synaptic density between deep and superficial subpopulations were observed in PCs and ipsiPVs but not in contraPVs. *p < 0.05, permutation test for mean; red ++p < 0.01, Conover–Iman scale test for scale; n.s., not significant. D, For subpopulations of PCs and PVs in deep and superficial sublayers, a summary of degrees of correlation (R2) between the measured and expected distribution of synapse numbers across branches. **p < 0.01, ****p < 0.0001, Welch's t test for mean; red +p < 0.05, Conover–Iman scale test for scale) and stacked bar plots of the percentages of highly structured, moderately structured, and nearly random neurons as defined by their R2 values.

