Figure 7.
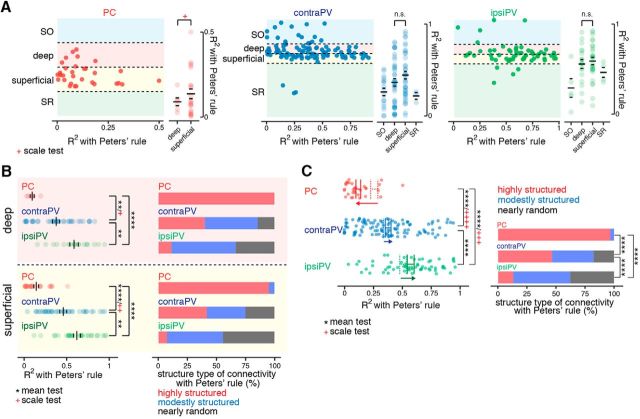
Sublayer-specific patterns of synaptic connectivity at the branch level with Peters' rule. A, Scatter plots (left) show the branch-level structure of connectivity (R2 value) given Peters' rule applied to neurons located in different hippocampal strata. Dots represent individual neurons. A summary of R2 values of individual neurons subclassified by layer and sublayer populations is also shown (right). Significant differences in R2 values with Peters' rule between deep and superficial subpopulations were observed in PCs but not in PVs. Red +p < 0.05, Conover–Iman scale test for scale (right); n.s., not significant. B, For subpopulations of PCs and PVs in deep and superficial sublayers, a summary of R2 values with Peters' rule (deep: **p < 0.01, ****p < 0.0001, permutation test for mean; red +p < 0.05, Conover–Iman scale test for scale; superficial: **p < 0.01, ****p < 0.0001, permutation test for mean; red ++p < 0.01, Conover–Iman scale test for scale) and stacked bar plots of the percentages of highly structured, moderately structured, and nearly random neurons as classified by R2 value with Peters' rule. C, A Summary of opposite changes in R2 with Peters' rule. Dots represent individual neurons, and solid lines indicate mean R2 with Peters' rule; overlaid dashed lines indicate the mean R2 with the dendritic-surface-only random model. ****p < 0.0001, permutation test; red +++p < 0.001, red ++++p < 0.0001, Conover–Iman scale test (left). Bar plots show the percentages of highly structured, moderately structured, and nearly randomly structured neurons as classified by R2 value; the results show that most PCs are highly structured, whereas more PVs are nearly random, compared with the dendritic-surface-only random model shown in Figure 4A. ****p < 0.0001, Fisher's exact test (right).

