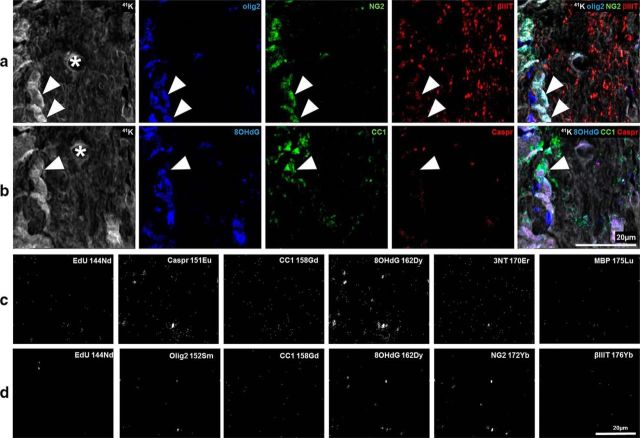
Figure 2.
Pseudofluorescence composite images confirming appropriate pixel distribution of metal-labeled antibodies of interest and negative controls. The pseudofluorescent composite images show distinctly different pixel distributions. a, b, The same FOV from normal optic nerve, captured using the two NanoSIMS scan settings described in Figure 1, to detect specific lanthanide-metal-conjugated antibodies of interest. a, 41K (gray) shows the location of nucleic and cytoplasmic regions. Olig2 (blue) and NG2 (green) indicate OPCs when colocalized (arrowheads). Olig2 and βIIIT (red) are present in nuclei and cytoplasm, respectively. b, 8OHdG (blue) staining pattern colocalizes with nuclei (arrowhead), within CC1+ (green) mature oligodendrocytes. CC1 and Caspr (red) labeling, both in the cytoplasm, with distinct staining patterns in line with their known cell structure distributions. *Center of the image from the first imaging scan. The NanoSIMS images of tissue not incubated with lanthanide-conjugated antibody. c, d, Distinctly different pixel distribution from the sections labeled with lanthanide-conjugated antibodies shown in Figure 1 (and a, b). c, d, The same FOV from normal optic nerve, captured using the NanoSIMS scan settings described in Figure 1 to detect the specific lanthanide metals of interest. c, Images acquired using the NanoSIMS calibrated to detect the following: 144Nd, 151Eu, 158Gd, 162Dy, 170Er, and 175Lu. d, The acquisition of 144Nd, 152Sm, 158Gd, 162Dy, 172Yb, and 176Yb within the same FOV. The NanoSIMS scan setting used to detect specific metal lanthanides are indicated on each image (c, d).

