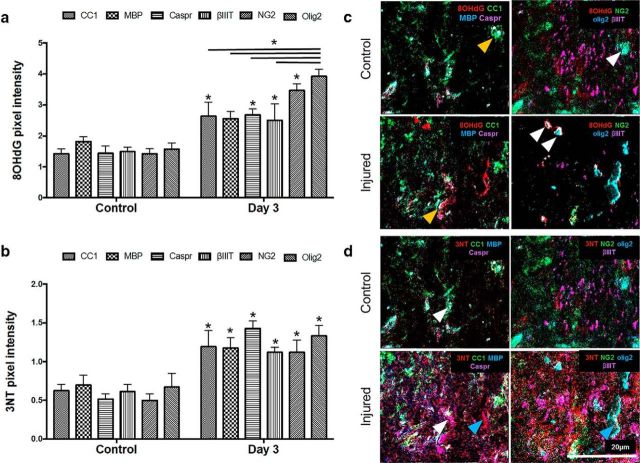
Figure 3.
Comparative analysis of DNA oxidation and protein nitration in cellular subpopulations and structures vulnerable to secondary degeneration in vivo. a, Mean ± SEM pixel intensity indicating increased DNA oxidation in CC1+, Caspr+, NG2+, and olig2+ areas following injury relative to control (*), as well as significant increases in DNA oxidation in olig2+ areas compared with other cellular subpopulations and structures following injury (* over bar). b, Mean ± SEM pixel intensity indicating increased protein nitration in CC1+, MBP+, Caspr+, βIIIT+, NG2+, and olig2+ areas following injury (*). Representative pseudofluorescent composite images show (c) DNA oxidation (red) in CC1+ (green), Caspr+ (purple), NG2+ (green), and olig2+ (blue) areas in control and injured optic nerve and (d) protein nitration (red) within CC1+ (green), MBP+ (blue), Caspr+ (purple), NG2+ (green), olig2+ (blue), and βIIIT+ (purple) areas. 8OHdG and 3NT images for control and injured nerve were each taken of the same FOV. c, Orange arrowheads indicate CC1+ (green) regions before and after injury. There is an increase in 8OHdG (red) pixel intensity within these regions after injury. c, White arrowheads indicate olig2+ areas. There is higher expression of 8OHdG (red) colocalized within these areas compared with other areas. d, White arrowheads indicate examples of CC1+ (green) areas colocalizing with 3NT (red) regions more with injury. Blue arrowheads indicate 3NT signal in the first image of injured tissue, colocalizing with white olig2/NG2/3NT in the second image. *p ≤ 0.01. n = 3/group.

