Figure 8.
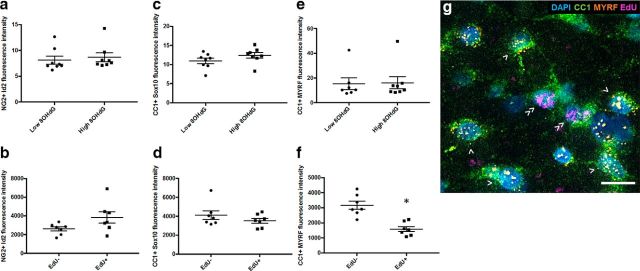
ID2, Sox10, and MYRF mRNA expression relative to 8OHdG immunoreactivity or EdU defined proliferation status in OPCs and oligodendrocytes. Fluorescence intensity of ID2 (a, b), Sox10 (c, d), or MYRF (e, f) mRNA fluorescence in situ hybridization signal in NG2+ OPCs at 3 (a) or 28 (b) days after injury and in CC1+ mature oligodendrocytes at 3 (c, e) or 28 (d, f) days after injury. At 3 d, comparisons are made between cells that have baseline or elevated 8OHdG immunoreactivity; at 28 d, comparisons are made between cells that are EdU− or EdU+. Each symbol represents the average for an animal. Error bars indicate mean values for the group. Statistical comparisons were made between groups. *p ≤ 0.05, differences in fluorescence intensity. g, Representative image at 28 d shows MYRF, EdU, CC1, and nuclei. CC1+/MYRF+/EdU− (>) and CC1+/MYRF−/EdU+ (≫) cells are indicated; MYRF+/EdU+ oligodendrocytes are seldom observed. Scale bar, 10 μm.

