Figure 9.
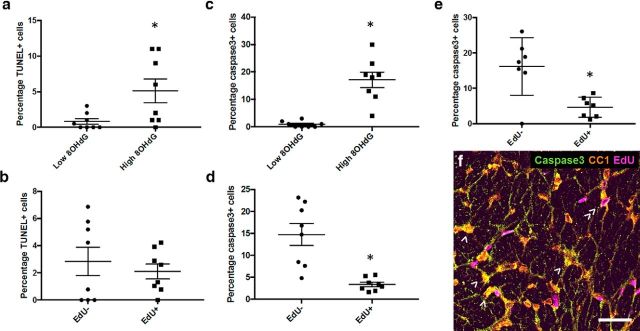
TUNEL labeling and caspase3 immunoreactivity relative to 8OHdG immunoreactivity or EdU defined proliferation status in oligodendrocytes. Percentages of CC1+ oligodendrocytes that are TUNEL+ at 3 d after injury; comparisons are made between all CC1+ cells based on 8OHdG immunoreactivity (a), then between EdU− and EdU+ cells, both with elevated 8OHdG (b). Similarly, percentages of CC1+ oligodendrocytes that are caspase3+ at 3 d after injury based upon 8OHdG immunoreactivity (c), then between EdU− and EdU+ cells, both with elevated 8OHdG (d). e, At 28 d, caspase3+ oligodendrocyte comparisons are confined to EdU−/+ as 8OHdG immunoreactivity is not elevated. Each symbol represents the average for an animal. Error bars indicate mean values for the group. Statistical comparisons were made between groups. *p ≤ 0.05, differences in percentages of TUNEL+ or caspase3+ cells. f, Representative image of caspase3, EdU, CC1, caspase3, EdU and CC1 immunoreactivity at 28 d. CC1+/caspase3+/EdU− (>) and CC1+/caspase3−/EdU+ (≫) cells are indicated; caspase3+/EdU+ oligodendrocytes are seldom observed. Scale bar, 20 μm.

