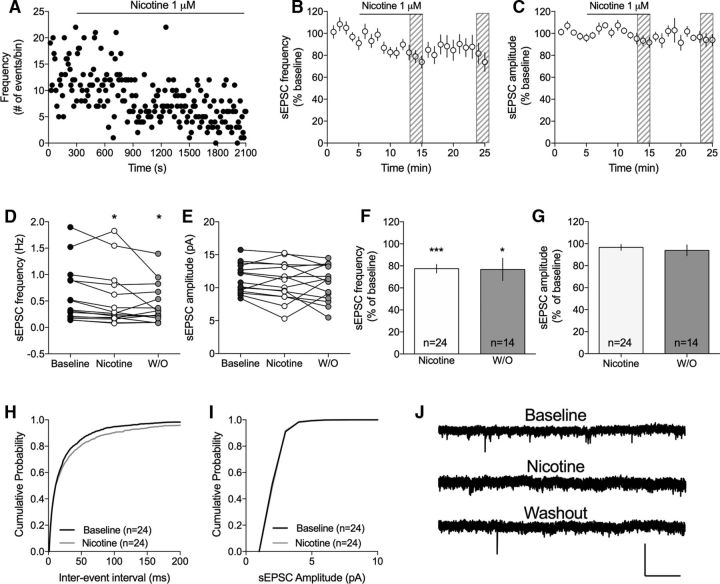
Figure 4.
Nicotine suppresses the frequency of excitatory inputs to MSNs. A, Time course graph showing sEPSC frequency in an example cell during continuous nicotine perfusion (1 μm). B, C, Graphs represent relative sEPSC frequency and amplitude over time. D, E, Scatterplots shows sEPSC frequency and amplitude at baseline, following 10 min of nicotine perfusion, and after 10 min washout (W/O) in individual neurons. F, G, Bar graphs represent mean change in sEPSC frequency and amplitude induced by 10 min exposure to nicotine. H, I, Nicotine significantly modulated the cumulative distribution of interevent intervals but had no effect on amplitudes. J, Representative traces show recorded sEPSCs at baseline, following 10 min of nicotine, and after 10 min washout. Calibration: 40 pA, 2 s. n = the number of cells taken from rats from at least three different litters. *p < 0.05, significant compared with baseline. ***p < 0.001, significant compared with baseline.

