Figure 2.
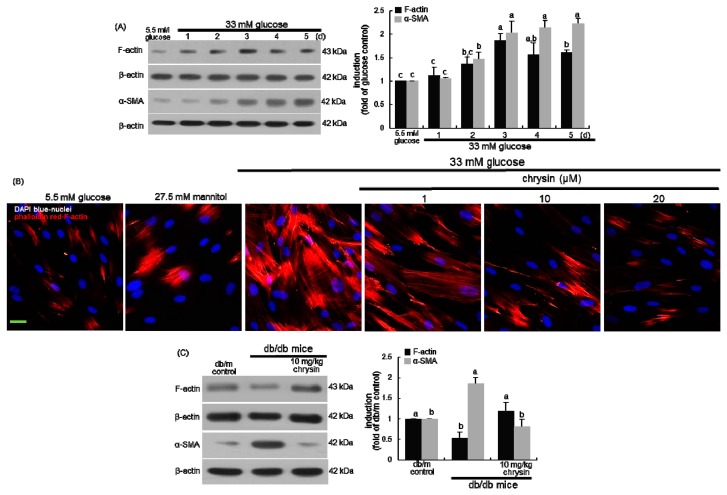
Temporal responses of protein induction of F-actin and α-SMA to glucose (A), inhibition of F-actin formation by chrysin in glucose-exposed human renal mesangial cells (HRMC, B) and tissue levels of F-actin and α-SMA in chrysin-treated diabetic kidneys (C). HRMC were challenged with 5.5 mM glucose, 5.5 mM glucose plus 27.5 mM mannitol as osmotic controls or with 33 mM glucose in the absence and presence of 1–20 μM chrysin. Diabetic mice were orally administrated with 10 mg/kg chrysin for 10 weeks. The induction of F-actin and α-SMA was measured by Western blot analysis using cell lysates and renal tissue extracts with a primary antibody of F-actin or α-SMA (A,C). β-Actin protein was used as an internal control. Representative blots shown are typical of three independent experiments. The bar graphs (mean ± SEM) in the right panel represent quantitative results obtained from a densitometer. Values not sharing a letter are different at p < 0.05. Red-rhodamine phalloidin staining for F-actin formation was conducted in high glucose-exposed HRMC (B). Nuclear counter-staining was done by using blue 4’,6-diamidino-2-phenylindole. Scale bar = 50 µm. Each photograph is representative of at least four animals. Magnification: 400-fold.

