Figure 7.
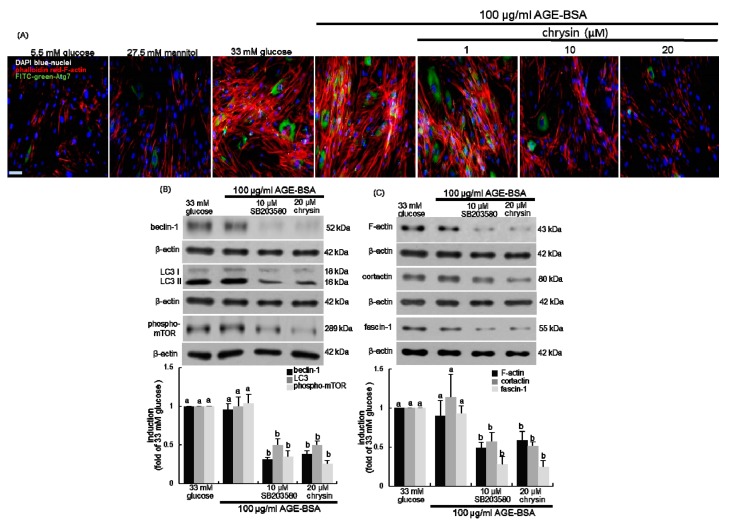
Involvement of autophagy and mTOR in F-actin formation and actin polymerization. Human renal mesangial cells (HRMC) were challenged for 3 days with 5.5 mM glucose, 5.5 mM glucose plus 27.5 mM mannitol as osmotic controls, 33 mM glucose or 100 μg/mL AGE-BSA in the absence and presence of 1–20 μM chrysin or 10 μM SB203580. The F-actin formation and Atg7 induction in glucose- or AGE-exposed HRMC were visualized with rhodamine phalloidine-red staining and FITC-green immunostaining, and nuclear counter-staining was done with the blue stain 4’,6-diamidino-2-phenylindole (A). Each photograph is representative of four different experiments and images were taken with a fluorescence microscope. 200-fold. Scale bar = 100 µm. Cellular induction of beclin-1, LC3, phospho-mTOR, F-actin, cortactin, and fascin-1 were measured by Western blot analysis with each of their primary antibodies (B,C). The bar graphs (mean ± SEM, n = 3) in the bottom panels represent quantitative results obtained from a densitometer. β-Actin protein was used as an internal control. Values not sharing a letter are different at p < 0.05.

