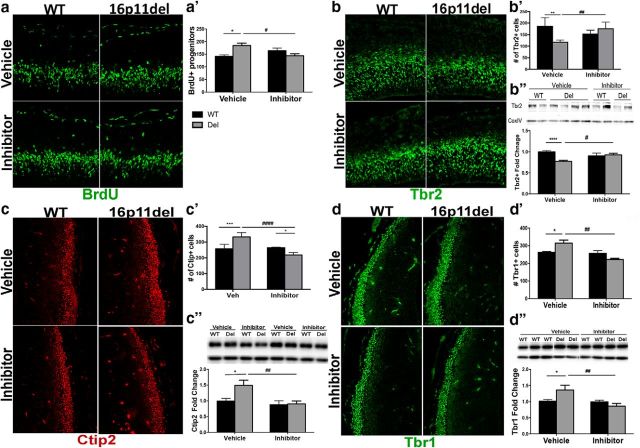
Figure 2.
Reversal of deficits in cortical neurogenesis in the 16p11.2del mice after treatment with ERK pathway inhibitor at E14.5. IHC of coronal sections and Western analyses of cortical lysates at E14.5 a, IHC with proliferation marker, BrdU injected 30 min. before kill. a′, The number of BrdU+ progenitors was analyzed (veh-treated: nWT = 8, nDel = 6; inh-treated: nWT = 9, nDel = 9; *p < 0.05, #p < 0.05). b, IHC with intermediate progenitor marker, Tbr2 (green). b′, Quantification of Tbr2+ progenitors (veh-treated: nWT = 11, nDel = 4; inh-treated: nWT = 9, nDel = 16; **p < 0.0012, ##p < 0.0052). b″, Quantification of Western analysis (veh-treated: nWT = 29, nDel = 37; inh-treated: nWT = 23, nDel = 21; ****p < 0.00001, #p < 0.0388). c, IHC for layer V marker, Ctip2 (red). c′, Quantification of Ctip2+ neurons (veh-treated: nWT = 5, nDel = 4; inh-treated: nWT = 4, nDel = 6; ***p = 0.0005, ####p < 0.0001, *p = 0.026). c″, Quantification of Western analysis (veh-treated: nWT = 15, nDel = 9; inh-treated nWT = 8, nDel = 11; *p = 0.0186, ##p = 0.0073). d, IHC with layer VI marker, Tbr1 (green). d′, Quantification of Tbr1+ neurons (veh-treated: nWT = 9, nDel = 9; inh-treated: nWT = 5, nDel = 5; *p = 0.025, ###p = 0.0004). d″, Quantification of Western analysis (veh-treated: nWT = 15, nDel = 7; inh-treated: nWT = 11, nDel = 12; *p = 0.038, ##p = 0.0017). All Western analyses data represented as a fold-change, normalized to a loading control. p Values are from Bonferroni post hoc analysis (*compares WT to deletion; #compares vehicle deletion to inhibitor deletion).

