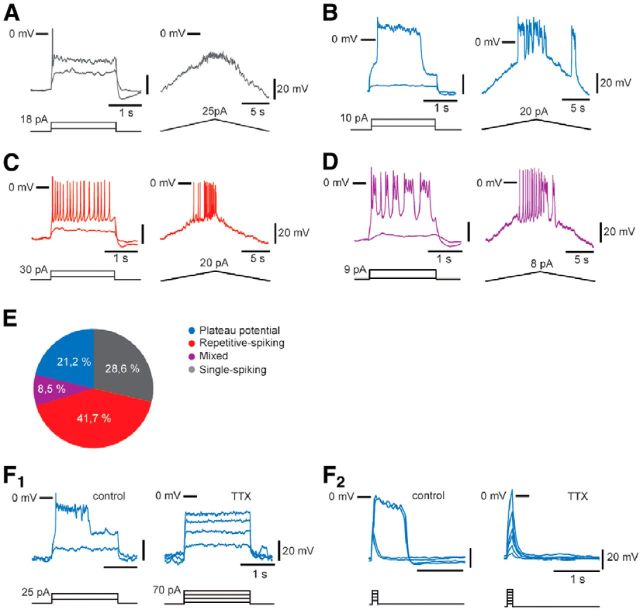
Figure 6.
V1R display different excitability patterns in E12.5 embryonic spinal cords. Excitability patterns were analyzed using depolarizing current step (2 s) and depolarizing current ramp (20 s). A–D, Representative traces of voltage responses showing single-spiking activity (A), plateau potential activity (B), repetitive AP firing (C), and mixed repetitive-spiking/plateau potential activity (D). E, Proportions of V1R subtypes according to the observed discharge patterns. 28.6% of V1R could not sustain repetitive spiking, 41.7% were repetitive-spiking V1R, 8.5% were mixed V1R, 21.2% were plateau potential V1R (n = 164). F, Plateau potentials are blocked by TTX (1 μm) application (n = 5/5; F1, F2). F2, Plateau potentials are evoked by short (100 ms) pulses of depolarizing current.

