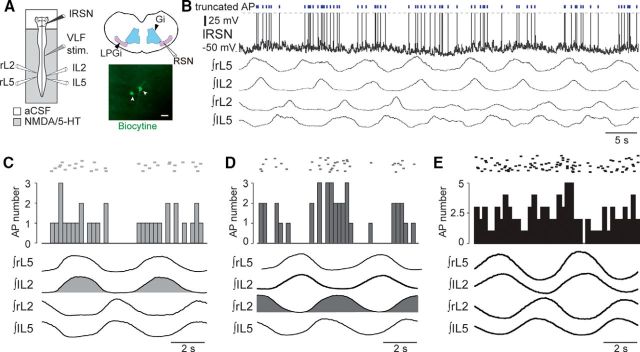
Figure 1.
Discharge patterns of RSNs during fictive locomotion. A, Left, Schematic of the isolated brainstem/spinal cord (ventral side up) and recording procedures. Right, Schematic coronal representation of the area where RSNs were recorded in the LPGi (top, purple shading) and two RSNs labeled with biocytin (bottom, white arrows, scale bar: 50 μm). B, Whole-cell patch recording of an RSN (top trace) during an episode of pharmacologically induced fictive locomotion. The RSN′s action potentials, which are truncated (dashed line), are indicated by vertical blue bars above the trace. Lower traces are integrated transforms of impulse activity recorded from rostral (bilateral L2) and caudal (bilateral L5) lumbar ventral roots. C–E, Raster plots (top) of spiking activity in three RSNs showing either phasic discharge in time with the left L2 ventral root (C, light gray) or right L2 ventral root (D, dark gray), or tonic discharge (E, black) during fictive locomotion. AP, action potential.

