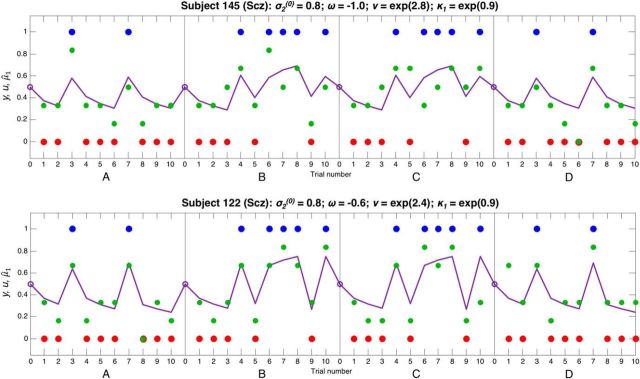
Figure 10.
Responses and model fits for 2 Scz subjects. These plots show 2 Scz subjects' responses to four 10-bead sequences in the same format as Figure 9. These subjects have similar evolution rate ω to the control subjects in Figure 9, but they both have a much higher κ1, meaning that they make much greater changes to their beliefs when presented with unexpected evidence, but do not reach certainty when faced with consistent evidence. Subject 122 (bottom) has a slightly higher evolution rate ω than Subject 145 (top), and so his switching between jars is even more pronounced. These subjects also have slightly lower (inverse) response stochasticity ν than the control subjects in Figure 9, and so their responses tend to be further from the model predictions.

