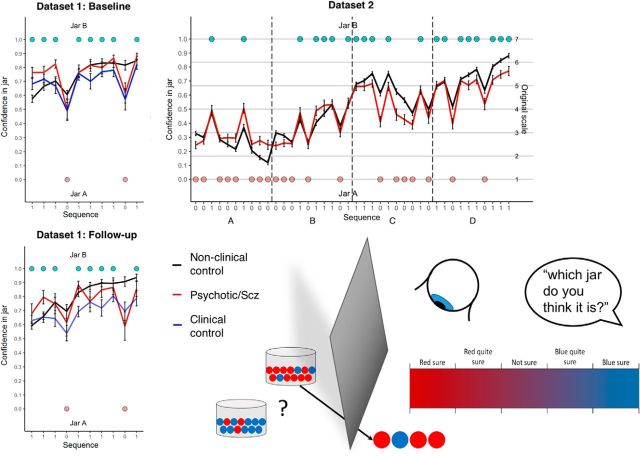
Figure 2.
Beads task schematic and group average confidence ratings in Datasets 1 and 2. Bottom right, Schematic of the beads task: two jars containing opposite proportions of beads are concealed from view, and a subject is asked to rate the probability of either jar being the source of a sequence of beads he/she is viewing (after each bead in turn). Top left, Mean (± SE) confidence ratings in the blue jar over the 10-bead sequence averaged across each group at baseline in Dataset 1. Bottom left, Same quantities at follow-up in Dataset 1. Top right, Quantities in four 10-bead sequences concatenated together (they were presented to the subjects separately during testing) in Dataset 2.

