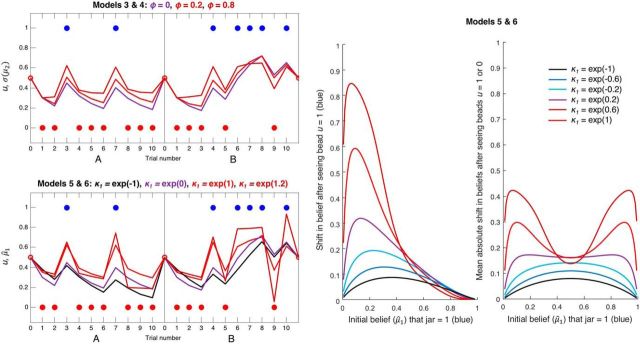
Figure 4.
Simulated data illustrating the effects of ϕ (Models 3 and 4) and κ1 (Models 5 and 6) on inference. Both panels represent simulated perceptual model predictions in the same format as before, with σ2(0) and ω set to their previous values; hence, the purple line in these plots is identical to that in Figure 3. The second level and simulated responses y have been omitted for clarity. Top left, Simulations of a perceptual model incorporating an autoregressive order (1) process at the second level, using three different values of AR(1) parameter ϕ: 0, 0.2, and 0.8. The estimate of the tendency on trial k + 1, μ2(k+1), is selected from a Gaussian distribution with mean μ2(k) + ϕ(m − μ2(k)) and variance σ2(k) + exp(ω). Over time, μ2 is therefore attracted toward level m (fixed to 0, i.e., at σ(μ2) = 0.5) at a rate determined by ϕ. In effect, this gives the model a 'disconfirmatory bias,' such that as ϕ increases, σ(μ2) is pulled further away from a belief in either jar, and toward 0.5 (maximum uncertainty about the jars). Bottom left, Simulations of a perceptual model using four different values of scaling factor κ1, which alters the sigmoid transformation: μ̂1(k+1) = s(κ1 · μ2(k)). When κ1 > exp(0), updating is greater to unexpected evidence and lower to consistent evidence; when κ1 < exp(0), the reverse is true. Red and brown lines (κ1 > exp(0)) indicate the effects of increasingly unstable attractor networks; that is, switching between states (jars) becomes more likely (a concomitant increase in vulnerability to noise, i.e., response stochasticity, is not shown). Green line (κ1 = exp(−1)) indicates slower updating around μ̂1 = 0.5, as was found in controls. κ1 permits a greater range of updating patterns than ϕ (the green and brown trajectories in the bottom cannot be produced by Model 4), which may be why Model 6 can fit both controls and Scz groups well. Middle, Plot represents the effects of κ1 on belief updating, as a function of the initial belief μ̂1 (σ2(0) and ω were set to 1.5 and −1, respectively, as in Fig. 5; changing these parameters does not qualitatively alter the effects of κ1 shown here). For values of κ1 < exp(0) = 1 (bottom three curves) and initial beliefs to the left of these curves' maxima (i.e., that the jar is probably red), relatively small increases in μ̂1 are made if one blue bead (u = 1) is observed, such that the subject still believes the jar is most likely red. For values of κ1 > exp(0.5) (top two curves), observing one blue bead causes such a large update for all but the most certain initial beliefs in a red jar that the subject's posterior belief is that the jar is probably blue. These subjects' beliefs are no longer stable, but neither can they reach certainty: only tiny updates toward 1 are possible for μ̂1 > 0.8. Right, Plot represents the average absolute shifts in beliefs on observing beads of either color. This 'vulnerability to updating' is highly reminiscent of the 'energy state' of a neural network model (schematically illustrated in Fig. 1) (i.e., in low energy states); less updating is expected. The effect of increasing κ1 is to convert confident beliefs about the jar (near 0 and 1) from low to high 'energy states' (i.e., to make them much more unstable).

