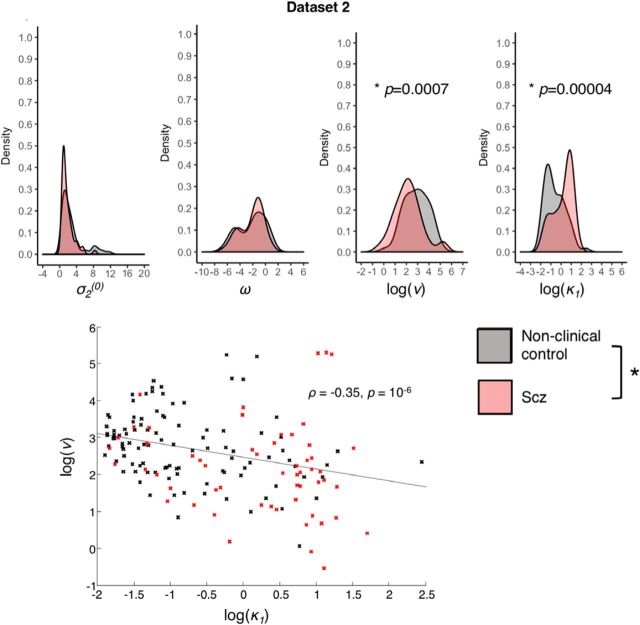
Figure 8.
Model 6 parameters in Dataset 2: distributions and correlation. Top, The distributions of parameter values for σ2(0), ω, log(ν), and log(κ1) are plotted for Dataset 2. *Significant group differences between the Scz group and nonclinical control subgroup (well matched in age and sex); the group difference in σ2(0) is not indicated because it was nonsignificant (p = 0.056) in the well-matched comparison. Bottom, The significant correlation between log(ν) and log(κ1) in Dataset 2 is plotted, with controls' parameters in black and Scz in red. Similar correlations were also found in Dataset 1 at both time points.

