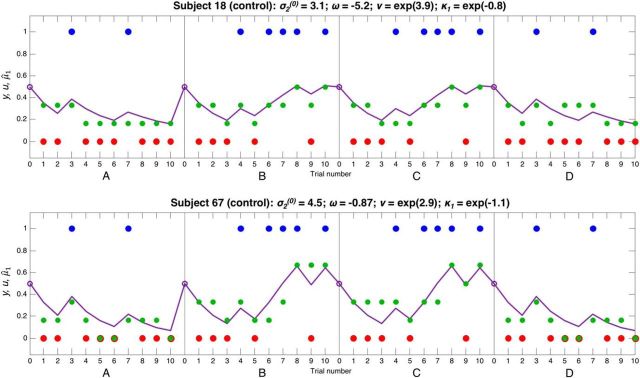
Figure 9.
Responses and model fits for 2 control subjects. These plots show 2 control subjects' responses to four 10-bead sequences concatenated together, in the same format as Figure 3 (but without the second level, due to space constraints); in the latter two sequences, blue and red were swapped around for model-fitting purposes. Each plot shows u(k), the beads seen by the subjects on trials k = 1,…, 10 (blue and red dots), y, the subject's (Likert scale) response about the probability the jar is blue (green dots), and μ̂1(k+1), the model's estimate of the subject's prediction the jar is blue (purple line). The parameter estimates for each subject are shown above their graphs. These subjects have fairly similar initial variance σ2(0), (inverse) response stochasticity ν, and instability factor κ1. Subject 18 in the top has a much lower overall evolution rate ω than Subject 67 in the bottom; therefore, Subject 18 never reaches certainty about either jar, and makes relatively small changes to her beliefs in response to beads of varying colors. Both subjects have a low κ1, and so they make relatively small adjustments to their beliefs following unexpected evidence (this behavior can best be captured by the models containing κ1; see Fig. 4). Subject 18's responses are very close to those predicted by the model, and this is reflected in her relatively high value of ν.

