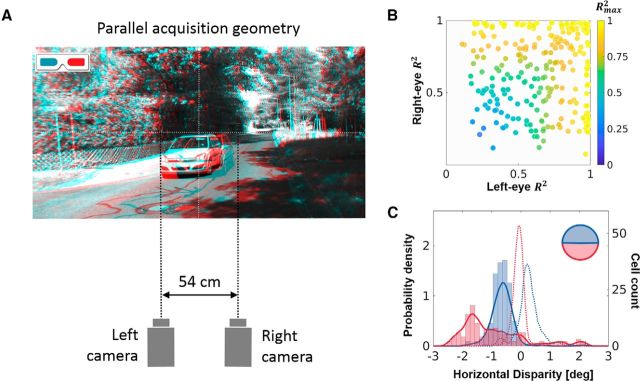
Figure 7.
The KITTI dataset. The model was tested using a second dataset (KITTI; for details, see Materials and Methods), which had a different acquisition geometry. A, Acquisition geometry. The cameras were parallel and separated by 54 cm, a geometry that does not resemble the human visual system. A cyan-red anaglyph reconstruction of a representative scene from the KITTI dataset is also shown. B, Gabor fit. The R2 value for the Gabor fit procedure on the left and right receptive fields of the converged neurons, with the color of the symbol coding for the Rmax2 (compare to Fig. 3A for the Hunter–Hibbard dataset). C, Horizontal disparity tuning. Horizontal disparity tunings for two populations of neurons trained on the upper (blue) and lower (red) hemifields of the KITTI database. For comparison, the curves obtained using the Hunter–Hibbard database (Fig. 4C) are plotted in dashed lines using the same color scheme.

