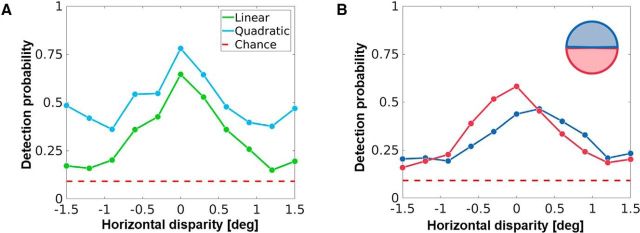
Figure 8.
Decoding disparity through RDSs. A, Output spikes of the V1 layer (foveal simulation) to RDS stimuli at various disparities were used to train linear (green) and quadratic (blue) discriminant classifiers. The RDS stimuli were chosen as they do not contain any other information except disparity. The performance of these classifiers was then tested using different sets of labeled RDS stimuli (10,000 total RDS stimuli; 70% used for training, 30% used for testing; cross-validation using 25 folds). This plot shows the detection probability (probability of correct identification), plotted against the disparity. The quadratic classifier performs better than the linear classifier, while both classifiers perform above chance level (in dashed red). B, Two populations of V1 neurons trained on the upper (blue) and lower (red) hemifields were used to test a linear classifier using the same stimuli as in A. The detection probability of the two classifiers reflects the population bias induced by the disparity statistics of the upper and lower hemifields (Fig. 5B).

