Figure 10.
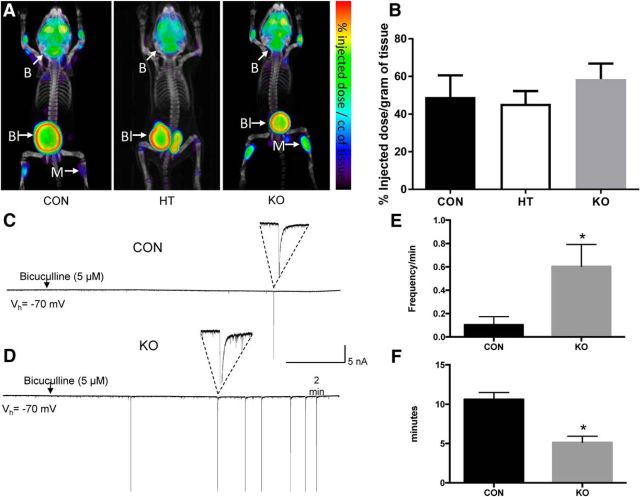
PET scan (A, B) and single-cell patch-clamp studies (C–F). Glucose uptake, as measured by 18F-FDG accumulation in whole brain, was unaffected by Glut3 concentrations in the brain. PN15 pups were injected intraperitoneally with ∼25 μCi of 18F-FDG. After 1 h, the mice were imaged with PET/CT (A), killed, and the amount of radioactivity in the brain was quantified on a gamma counter. B, Brain; BL, bladder; M, muscle. [ANOVA, F statistic (df: 2, 14) = 0.66]. B, Representative examples of paroxysmal discharges in pyramidal neurons from CON and glut3 KO mice at PN17. Examples of traces from CON (C) and glut3 KO pyramidal cells (D). Neurons were held at −70 mV; arrow indicates the onset of bicuculline (BIC, 5 μm) application. Insets show a detailed view of the paroxysmal events. Note that, in addition to the occurrence of more paroxysmal discharges, glut3 KO neurons display paroxysmal events earlier than CON neurons. Graphs represent the frequency and latency of paroxysmal activity in CON and KO mice. The total number of paroxysmal events was quantified and divided by the 15 min duration of the recording session (E). There was a significantly higher number of paroxysmal discharges in KO mice (*p = 0.0259, n = 8 in both groups). Latency to the first paroxysmal discharge was also determined (F). There was significantly reduced latency to the first paroxysmal event in cells from KO mice (*p = 0.0037 vs CON, n = 8 for KO and 3 for CON). Data were analyzed by unpaired Student's t test and are represented as mean ± SEM.

