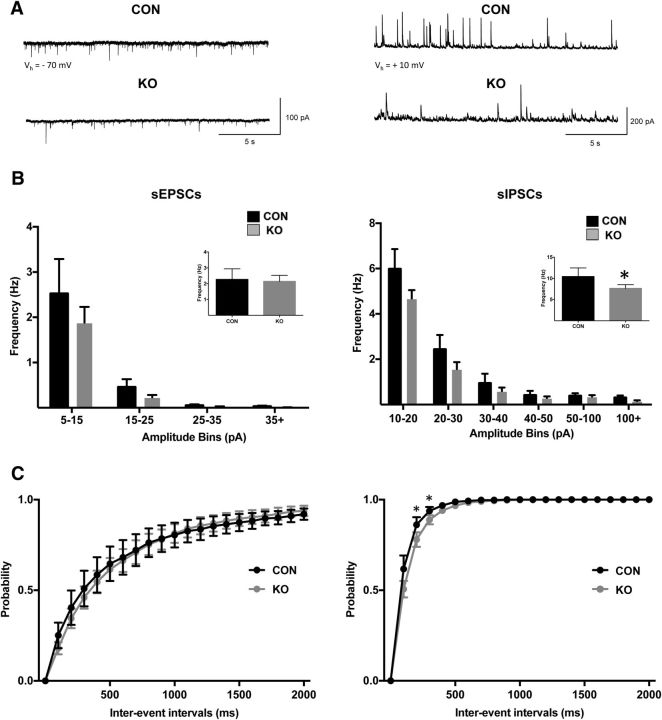
Figure 13.
A, Representative traces of sEPSCs (left) and sIPSCs (right) in a pyramidal neuron from CON and KO mice at holding potentials (Vh) of −70 mV and +10 mV, respectively. B, Amplitude–frequency histograms for sEPSCs (left) and sIPSCs (right) in CON and KO neurons. No significant changes in either sEPSCs or sIPSCs frequencies at different amplitude bins were observed between CON and KO neurons. Insets show the average frequency of sEPSCs (left) and sIPSCs (right). Although no significant change in average frequency was observed in sEPSCs, KO pyramidal neurons showed a significant decrease in sIPSC average frequency relative to CON neurons. Amplitude–frequency histogram data were analyzed by two-way ANOVA followed by Bonferroni's multiple-comparisons test. Average frequency data shown in graphs were analyzed by unpaired Student's t test, *p = 0.04. C, Cumulative interevent interval histograms for sEPSCs (left) and sIPSCs (right). Although no significant change was observed for sEPSC cumulative interevent interval histograms, for sIPSCs, the KO group was shifted to the right, and the difference between CON and KO groups was significantly different for the 300–400 ms bins indicating decreased frequency of sIPSCs. Data were analyzed by two-way ANOVA followed by Bonferroni's multiple-comparisons test, n = 10 neurons for KO, n = 8 neurons for CON, *p < 0.05.

