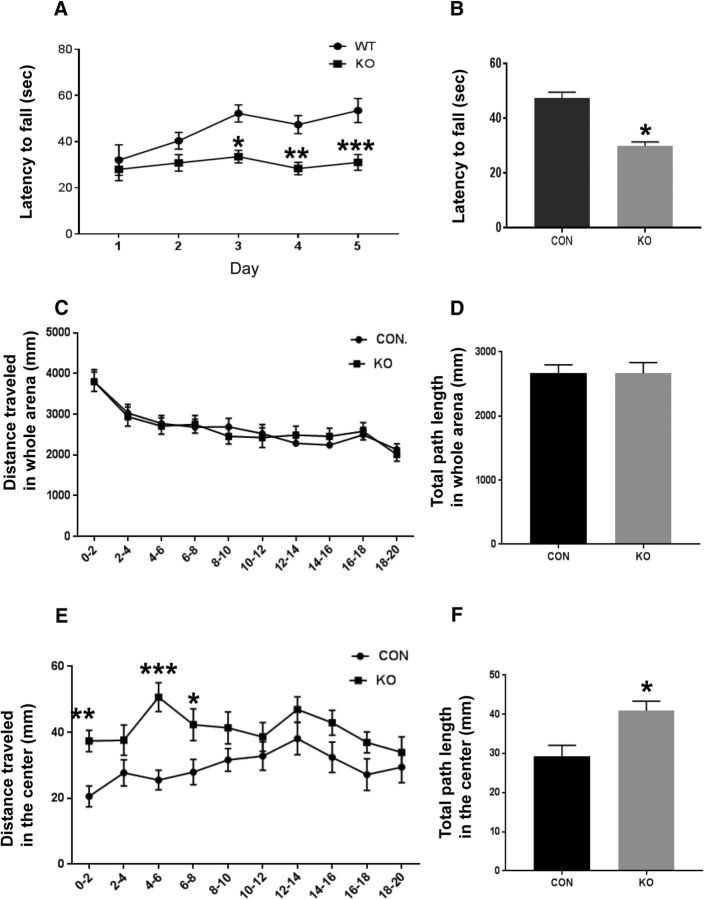
Figure 14.
A, Accelerating rotarod test was performed to assess motor learning and motor coordination. KO mice showed significant motor coordination problems and fell sooner from the rod than CON mice (two-way ANOVA followed by Sidak's multiple-comparisons test (interaction, F statistic [df: 4, 181] = 1.416, p-value = 0.2304; genotype, F statistic [df: 1, 181] = 31.77, p-value <0.0001; *p = 0.0010 for day 3, **p = 0.0008 for day 4, ***p = 0.0002 for day 5. KO; n = 16 for day 1, n = 21 for day 2–4 and n = 20 for day 5, CON; n = 5 for day1, n = 22 for day 2–4 and n = 21 for day 5). B, Motor learning was observed in only the CON group. KO mice were significantly different from CON when comparing latency to fall from the rod at day 2–5, Mann–Whitney test (sum of ranks [11246, 7090; df: 189. *p-value <0.0001, (KO: n = 99, CON: n = 92 mice). C–F, Open-field task. KO mice showed normal movement and activity but less anxiety compared with CON mice. C, D, Distance traveled in whole arena. Both KO and CON mice spent a similar time and traveled alike in distance within whole arena during 20 min (KO: n = 21, CON: n = 22 mice, unpaired t test, t statistic [df: 41] = 0.015, p-value = 0.99 in D). E, F, Distance traveled in center of arena. CON mice spent less time in the center of arena and showed more tendencies in staying next to the corners, whereas glut3 KO mice spent more time in the center (KO: n = 21, CON: n = 22 mice), two-way ANOVA (genotype: F statistic [df: 1410] = 38.12, p-value <0.0001; time spent: F statistic [df: 9410] = 1.75, p-value = 0.08; genotype × time spent interaction: F statistic [df: 9410] = 1.02, p-value = 0.42 in E: 0–2, **p = 0.0046, 4–6, ***p < 0.0001, 6–8, *p = 0.0154; unpaired t test, t statistic [df: 41] = 3.124, *p-value = 0.0033 in F).

