Figure 6.
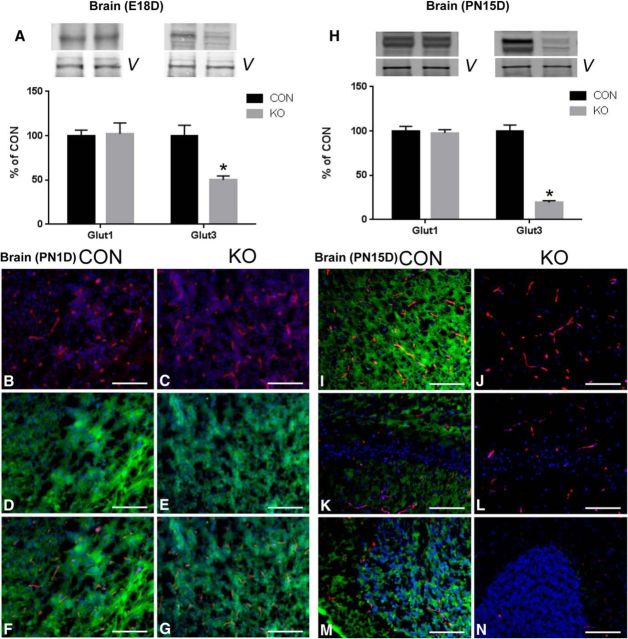
Expression of Glut1 and Glut3 in the brain at E18 (A), P1 (B–G), and PN15 (H–N). Western blot analysis of Glut1 and Glut3 proteins in E18 (A) and PN15 (H) brains is shown. Top, Representative Western blots. Bottom, Densitometric quantification of corresponding proteins. A, Expression of the glut3 gene is significantly decreased in the brains of E18 KO mice (t test, t statistic [df: 4] = 3.95, *p-value = 0.017), whereas there was no difference between CON and KO mice with Glut1 (t statistic [df: 4] = 0.1625, p-value = 0.88), n = 3 for each group. H, Expression of the glut3 gene is significantly decreased in PN15 as well (t statistic [df: 16] = 13.92, *p-value <0.0001), whereas there was no difference between CON and KO mice with Glut1 (t statistic [df: 15] = 0.3644, p-value = 0.72). Vinculin (v) served as an internal CON, n = 11 for KO, n = 7 for CON. Immunofluorescence localization of Glut1 and Glut3 proteins in PN1 brain (CON: B, D, F; KO: C, E, G) and PN15 brain (CON: I, K, M; KO: J, L, N). Glut1 protein was expressed in capillaries (both CON and KO). There are no differences in the expression of Glut1 (B, C), whereas Glut3 protein was reduced in KO (E) versus CON (D). At PN15, Glut1 protein (red) was expressed in capillaries of the cortex (I, J), hippocampus (K, L), and cerebellum (M, N) (both CON and KO). Glut3 protein (Alexa Fluor 488) was dramatically decreased in the cortex, hippocampus, and cerebellum of KO mice. Scale bars, 100 μm.

