Figure 8.
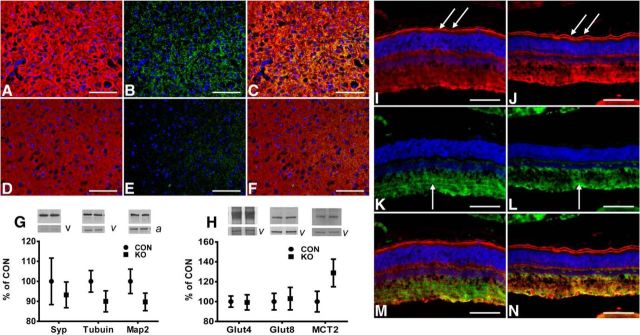
Synaptophysin (Syp), Map2, Tubulin, Glut4, Glut8, and MCT2 genes in brain at PN15. Immunofluorescence localization of synaptophysin (A, D) and Map2 (B, E) proteins (CON: A–C; KO: D–F). Synaptophysin and Map2 were reduced in the brainstem of KO mice (D, E) compared with CON. A, B, C, and F show yellow fluorescence from double exposures of synaptophysin (red) and Map2 (green). G, H, Western blot analysis of synaptophysin, tubulin, and Map2 proteins (G) and Glut4, Glut8, and MCT2 proteins (H). Top, Representative Western blots. Bottom, Densitometric quantification of corresponding proteins. There was no significant difference between CON and KO mice in the expression of synaptophysin (t statistic [df: 16] = 0.54, p-value = 0.60), tubulin (t statistic [df: 16] = 1.313, p-value = 0.21) and Map2 (t statistic [df: 16] = 1.41, p-value = 0.18) by unpaired t test, n = 10 in KO, n = 8 in CON. In addition, the expression of MCT2 (t statistic [df: 16] = 1.6, p-value = 0.13) was not different in KO compared with CON. n = 9 in KO, n = 7 in CON. Vinculin (v) and actin (a) were used as internal CONs. Immunofluorescence localization of Glut1 and Glut3 proteins in retina at PN15 is shown. Glut1 protein is mainly expressed in the retinal pigment epithelium (I, J, arrows) in both CON (I) and KO (J). However, Glut3 was dramatically decreased in the inner plexiform layer of KO mice. Arrows in K and L indicate Glut3 immunoreactivity. M and N show double exposure of Glut1 and Glut3 proteins in retina. CON: I, K, M; KO: J, L, N. Scale bars, 100 μm.

