Figure 6.

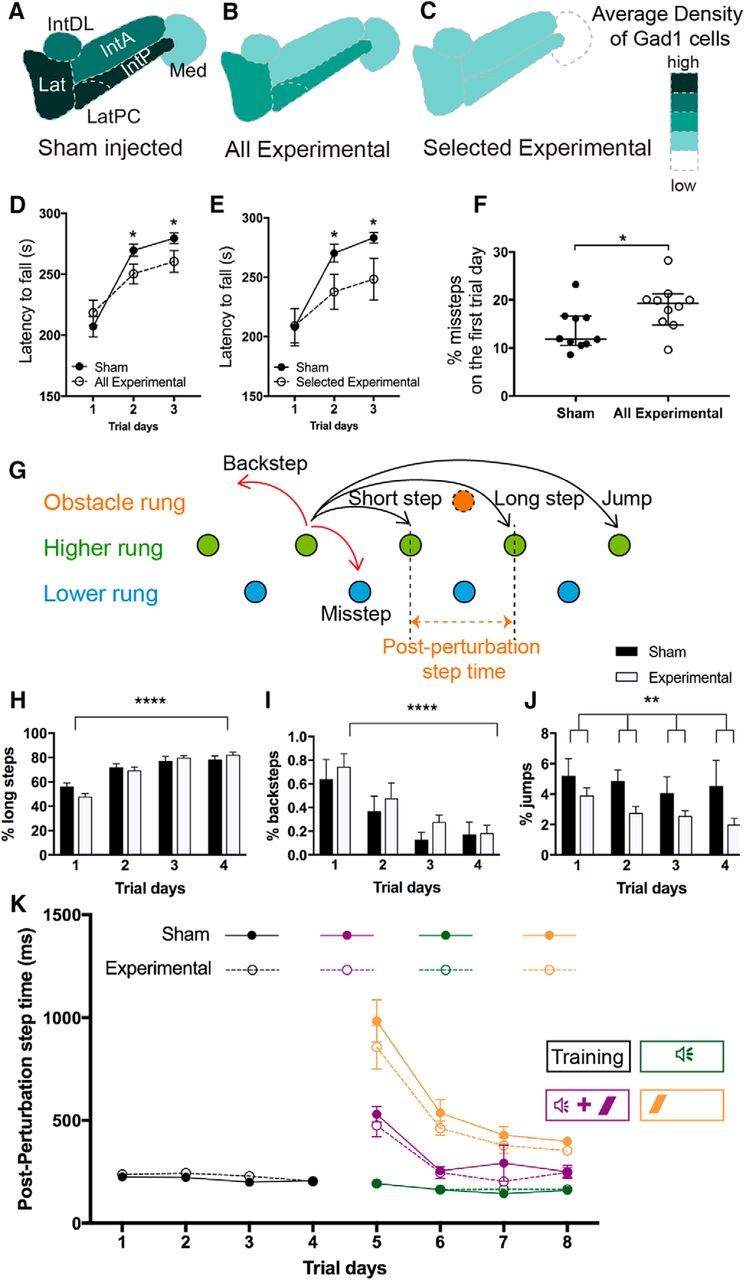
Targeted ablation of Sox14 neurons leads to locomotor dysfunction. Assessment using Gad1 labeling as a measure of nucleo-olivary cell loss is shown. A–C, The schematic represents the average density of Gad1-reactive cells in the sham-injected mice (A), all the Sox14Cre/+ experimental mice (B), and selected averaged data for the six experimental mice that showed extensive cell loss (>70%) compared with sham (C). D, Rotarod data for all experimental mice against the sham-injected group. The experimental mice show significantly reduced latencies for both day 2 (p = 0.0324) and day3 (p = 0.0374). E, Rotarod data for the six selected experimental mice shown in C against the sham-injected group. The selected group performed worse with significantly reduced latencies for both day 2 (p = 0.041) and day 3 (p = 0.036). Mean ± SEM; two-way ANOVA followed by Bonferroni's post-tests: main effect of trial time, F(2,120) = 1122, p < 0.0001; main effect of ablation, F(1,120) = 4.479, p = 0.0064; ablation × trial time interaction, F(2,1.20) = 1.25, p = 0.2903. F, Percentage of missteps measured on the introduction onto the Erasmus ladder apparatus shows the experimental group initially made more mistakes compared with the sham group. The median percentage of missteps in the sham and experimental groups was 11.85 and 19.26%, respectively; thus the distributions in the two groups differed significantly (Mann–Whitney U test, 23; n1 = 10, n2 = 10, p = 0.0433, two-tailed; median with 95% Cl). G, The various types of steps that are measured (image adapted from Noldus). The mouse ordinarily prefers to travel along the top set of rungs (green) and can perform short, long, or jump steps according to how many rungs are skipped between steps. The mouse may also take back steps, moving backward against the tailwind, or perform a misstep, where a mistake leads the mouse to step onto a lower set of rungs (blue). During associative learning trials, an obstacle rung (orange) may swing up to obstruct the path of the mouse so that it must step over the rung. Although the placement of the obstacle rung may change between trials, the postperturbation step time is defined as the time between activation of the rung before the obstacle to the rung after the obstacle. H–J, Usage of various step types over the training days (days 1–4). H, The percentage of steps that were long steps used in each trial day. The effect of trial days was extremely significant (p < 0.0001, F(3,80) = 36.32). I, The percentage of steps that were backsteps used in each trial day. The effect of trial days was extremely significant (p < 0.0001, F(3,80) = 9.27). J, The percentage of steps that were jumps used in each trial day. The effect of ablative injection was significant, showing a decreased percentage of jumps in the experimental animals compared with sham (adjusted p = 0.0033, F(1,80) = 9.20, two-way ANOVA corrected method of Benjamini and Yekutieli, mean ± SEM). K, Postperturbation step times in the different associative learning trials. During the first 4 d, only undisturbed trials were run to train the mice to traverse the ladder. Since there is no obstacle in these trials, the postperturbation step time is the average step time for a normal step (black). On days 5–8, trials are run so that the mouse is presented with either CS-only (green), US-only (orange), or paired CS–US (purple) stimuli. Where there is an obstacle presented in the trial, the postperturbation step time will increase if the mouse is not anticipating the obstacle. In all trial types, there was no significant difference in postperturbation step time between the two groups (mean ± SEM). US, Unconditioned stimulus; CS, conditioned stimulus; Lat, Lateral nucleus; LatPC, parvicellular lateral nucleus; IntDL, dorsolateral interposed nucleus; IntA, anterior interposed nucleus; Med, medial nucleus; IntP, posterior interposed nucleus. *p < 0.05; **p < 0.01; ****p < 0.0001.
