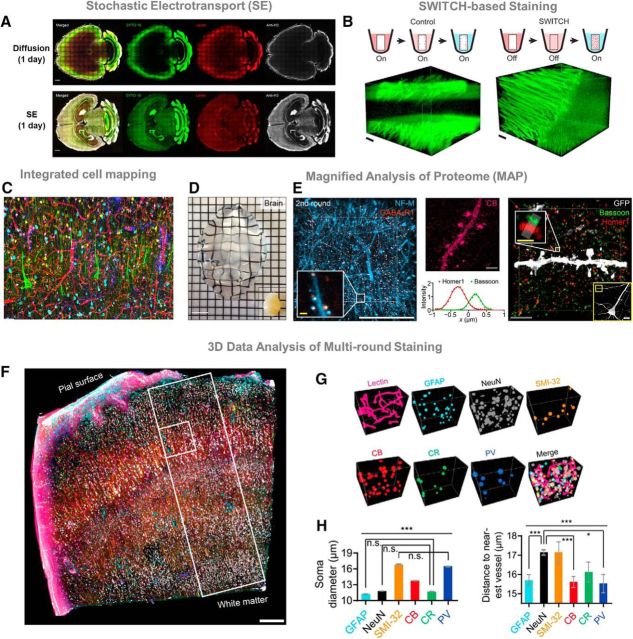
Figure 5.
A, CLARITY-processed mouse brains were stained with SYTO 16 (green), tomato lectin (red), and anti-histone H3 antibodies (white). Compared with standard diffusion (top row), Stochastic electro-transport (SE) (bottom row; Kim et al., 2015) accelerates tissue labeling with fluorescent markers by applying a rotational electric field. SE achieves complete and uniform staining of an adult mouse brain in a single day. Scale bar, 1 mm. B, SWITCH (Murray et al., 2015) is a method that enables uniform tissue processing for large-scale tissues. Molecule transport is decoupled from its interaction with the sample. For example, DiD lipid dye under standard diffusion produces incomplete staining mostly saturated at the tissue surface (left). In SWITCH, the reactivity of fixatives, dyes, and antibodies is suppressed in SWITCH-OFF buffer to allow the probes to readily diffuse deep into the tissue. For DiD, OFF buffer contains a low concentration of SDS detergent to block lipid binding until the tissue is saturated. Then, transfer to “ON buffer” DiD dye binds to lipids (right). SWICTH technique produces rapid and uniform tissue staining compared with standard diffusion. Scale bar, 200 μm. C, Tissue processing in the Chung laboratory enable multiple rounds of antibody staining. Here, we show a fully coregistered image showing various cell types in human visual cortex. D, MAP (Ku et al., 2016) physically expands tissues to achieve a fourfold increase in image resolution. MAP is applicable to intact organs, such as mouse brain. Scale bar, 1 cm. E, Left, A 3D render of a cortical sample stained with neurofilament medium unit (NF-M; blue) and GABAB receptor subunit-1 (GABABR1; red) antibodies; inset, synaptic neurofilaments colocalized with GABAergenic postsynaptic proteins. Middle, a maximum intensity projection image of calbindin (CB; magenta) showing dendritic spines. Right, synaptic structures in MAP samples resolved with a presynaptic (bassoon) and postsynaptic marker (homer1) in the cortex. Yellow box shows a GFP-positive neuron; white box highlights the elliptical structures of presynaptic and postsynaptic proteins distributed at a synaptic junction. The intensity of markers along the synapse axis confirms separation of presynaptic and postsynaptic markers. Scale bars: white, 50 μm; gray, 10 μm; yellow, 1 μm. F, SWITCH glutaraldehyde-reinforced human brain tissue shows a coregistered overlay of 9 of 22 different rounds of immunostaining. Scale bar, 300 μm. G, Information-rich datasets obtained from multi-round staining can be used for quantitative analysis of 3D volumes. H, As a proof-of-concept soma diameter and distance to nearest blood vessel are compared for six different cell types (*p < 0.05, ***p < 0.001; ANOVA).

