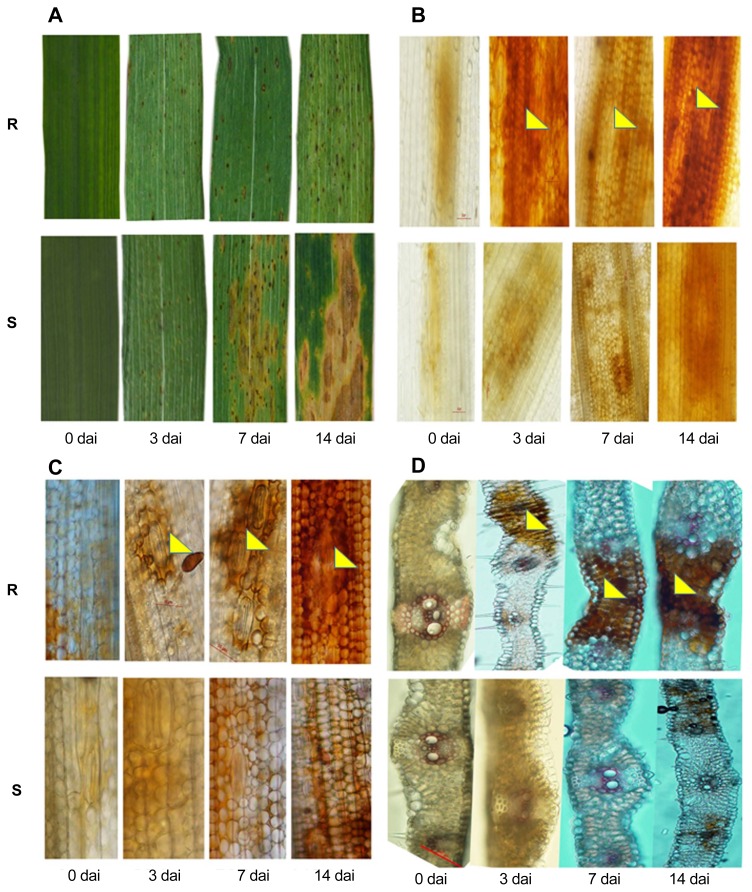
Fig. 5.
(A) Symptoms of B. sorokiniana on flag leaves over time; (B) Differential accumulation of H2O2 in response to B. sorokiniana visualized by DAB staining in flag leaves under time scan 0 to 14 days after infection (DAI). (C) Lignin deposition in flag leaves in response to B. sorokiniana as visualized by phloroglucinol-HCl staining in a longitudinal section of leaves from 0 to 14 DAI. (D) Lignin deposition in flag leaves in response to B. sorokiniana as visualized by phloroglucinol-HCl staining in the transverse section of leaves from 0 to 14 DAI. The upper panel represents resistant (R) genotype (Cv. Yangmai6) and the lower panel the susceptible (S) genotype (Cv. Ciano T79). Penetration points are marked by yellow arrowheads. Red line shown in the picture indicates size bar.

