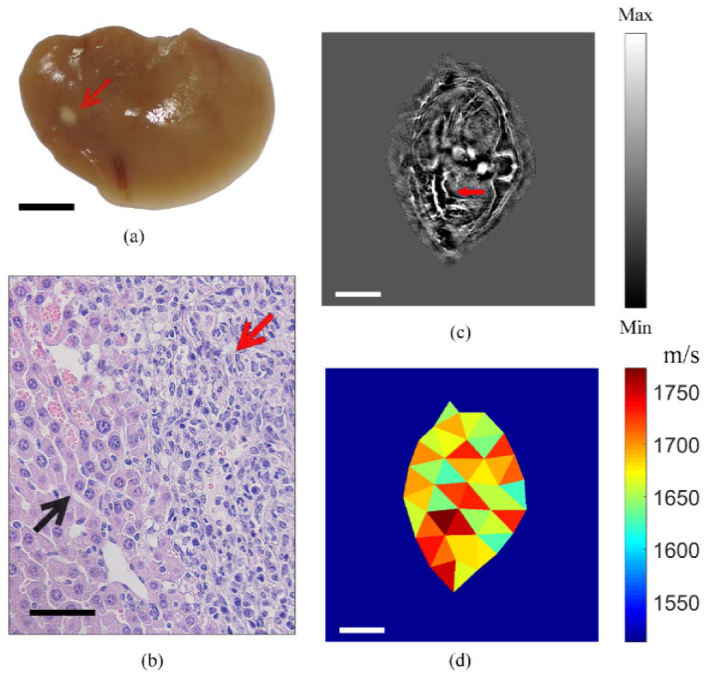
Fig. 6.
In vivo PA imaging of an orthotopic mouse model of HepG2. (a) The dissected liver with the tumor. The red arrow points to the tumor. (b) H&E of histological section of (a) showing the tumor boundary. Black and red arrows point to the normal and tumor regions, respectively. (c) Cross-sectional image taken at the liver region of a living mouse carrying the tumor. The IP image was reconstructed after applying an SOS map generated by FC optimization. Red arrow points to a ‘feeding’ vessel of the tumor. (d) The reconstructed SOS distribution corresponding to (c). Scale bars: (a)(c)(d) 5 mm; (b) 40 .

