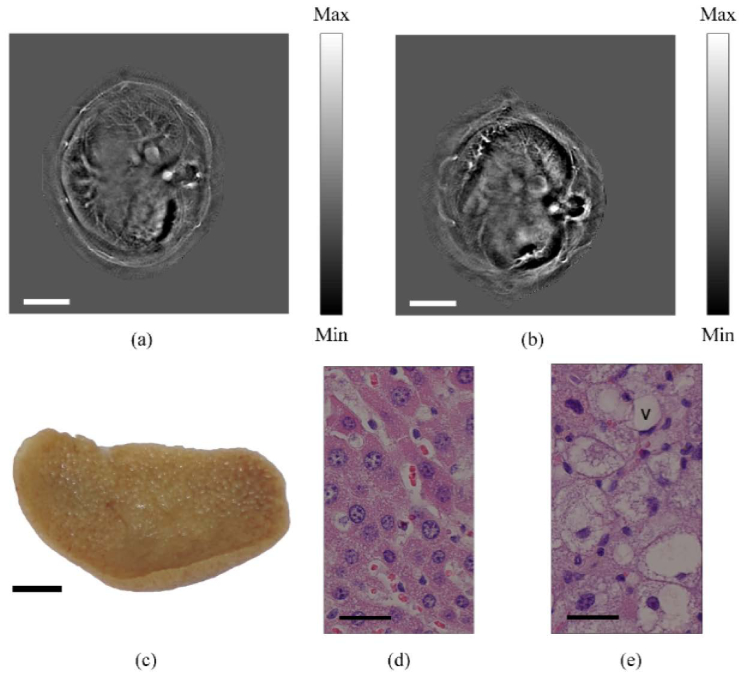
Fig. 7.
In vivo PA imaging of hepatic injury. The reconstructed images of normal liver (a) and liver with hepatic injury (b) of BALB/cAnNCrl mice. The SOS maps used in these reconstructions were generated by FC optimization. (c) Photography showing the dissected liver with hepatic injury. (d) H&E stained specimen of a healthy liver. (e) H&E stained specimen of a liver with hepatic injury. V: vacuole. Scale bars: (a)(b)(c) 5 mm. (d)(e) 20 .

