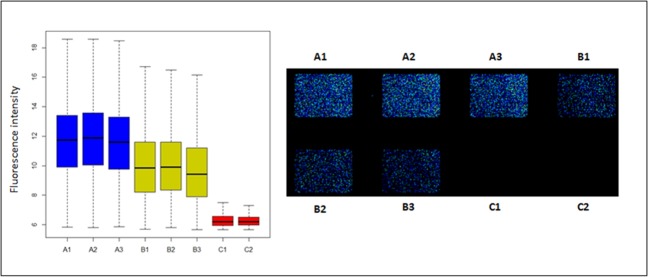
Fig 3.
Fluorescence signal of hybridization conditions on the microarray represented in boxplot (left) and the microarray slide (right). Control group (A1, A2 and A3 in both cases) corresponds to the three experimental replicates of planktonic Porphyromonas gingivalis ATCC 33277. Test group (B1, B2 and B3 in both cases) represents the multispecies biofilm including P. gingivalis. And the negative control group (C1 and C2 in both cases) shows the multispecies-biofilm without P. gingivalis.

